
Last analysis expected upwards movement for Tuesday’s session. The short term target at 1,447 was exceeded by 8.51 points.
Upwards movement is well within allowable limits for the wave count, price remains below the invalidation point.
The two daily wave counts differ at monthly chart level and cycle degree. Members may review monthly charts here.
Click on the charts below to enlarge.
First Daily Wave Count.
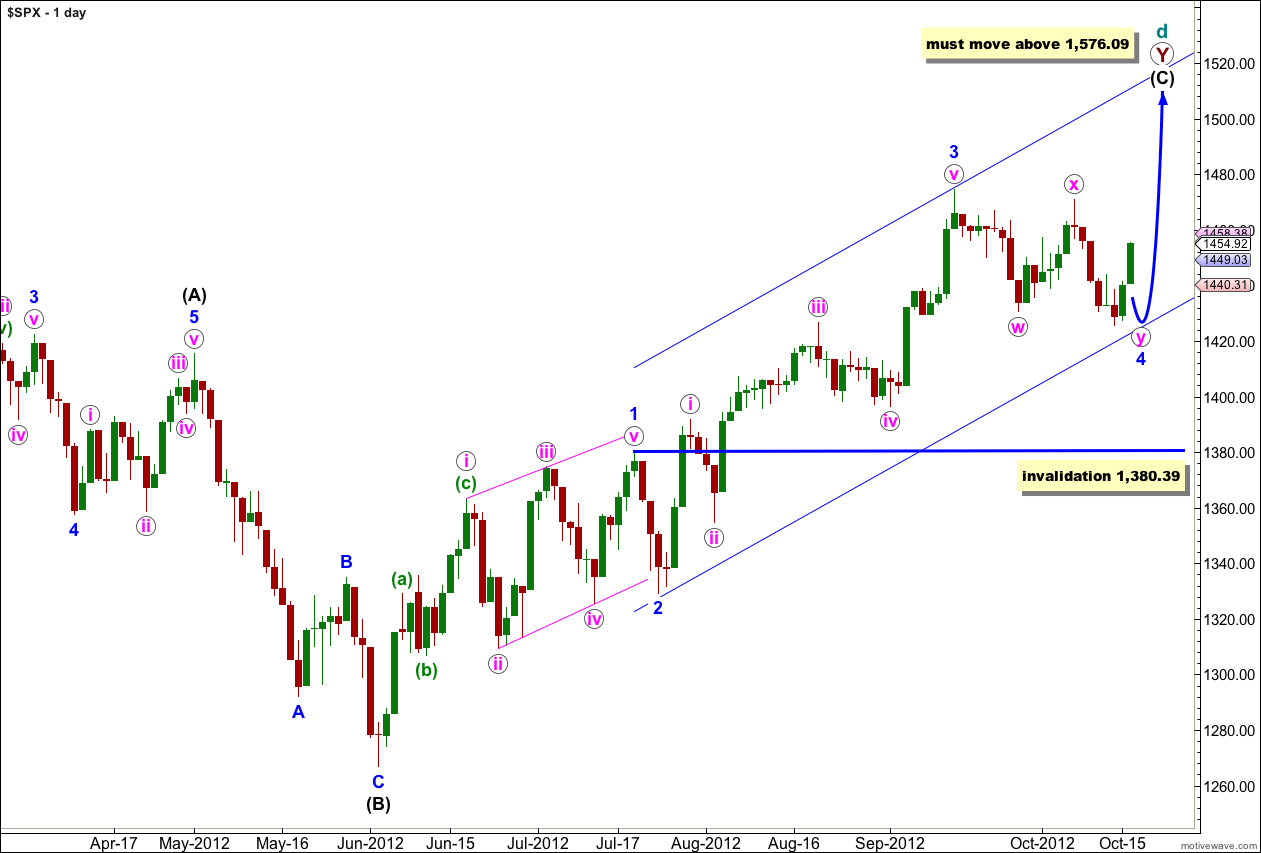
At super cycle degree this wave count sees a very rare expanding triangle unfolding, and cycle wave d upwards within the triangle is a double zigzag which must move beyond the end of cycle wave b.
Within the second zigzag of the double, primary wave Y, wave (C) black must unfold as a five wave structure.
Waves 1 through to 3 blue are complete. Wave 2 blue unfolded as a brief zigzag, and wave 4 blue looks like a double zigzag exhibiting alternation.
Further downwards movement for wave 4 blue may not move into wave 1 blue price territory. This wave count is invalidated with movement below 1,380.39.
When Elliott’s first channeling technique is used about this impulse it does not work. The channel will have to be drawn correctly when wave 4 blue is complete.
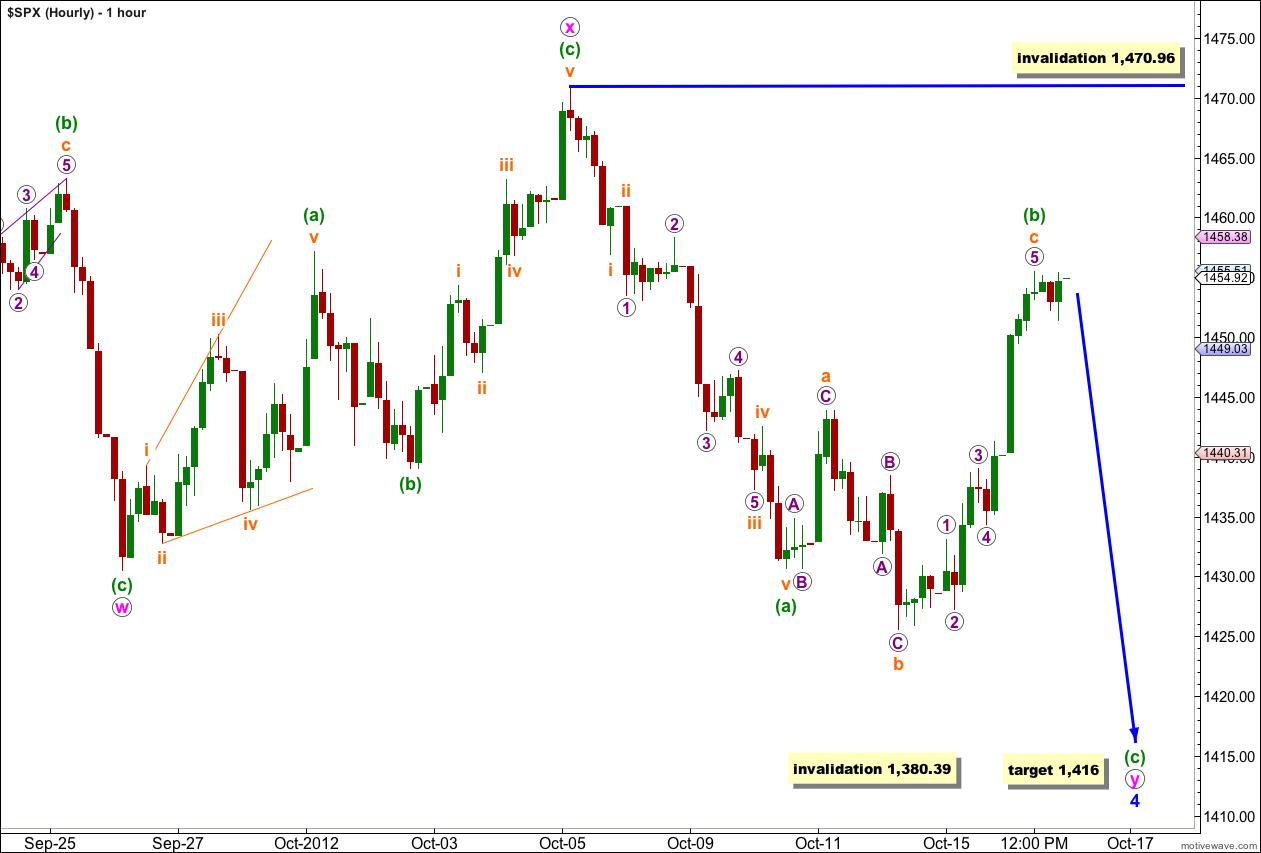
Within the possible double zigzag of wave 4 blue the second zigzag wave y pink is unfolding.
Within wave y pink wave (b) green may have completed during Tuesday’s session. Wave c orange has no Fibonacci ratio to wave a orange.
Ratios within wave c orange are: wave 3 purple is just 0.54 points short of 1.618 the length of wave 1 purple, there is no Fibonacci ratio between wave 5 purple and either of 1 or 3 purple.
At 1,416 wave (c) green would reach equality in length with wave (a) green.
If wave (b) green moves any higher it may not move beyond the start of wave (a) green. This wave count is invalidated with movement above 1,470.96.
Second Daily Wave Count.
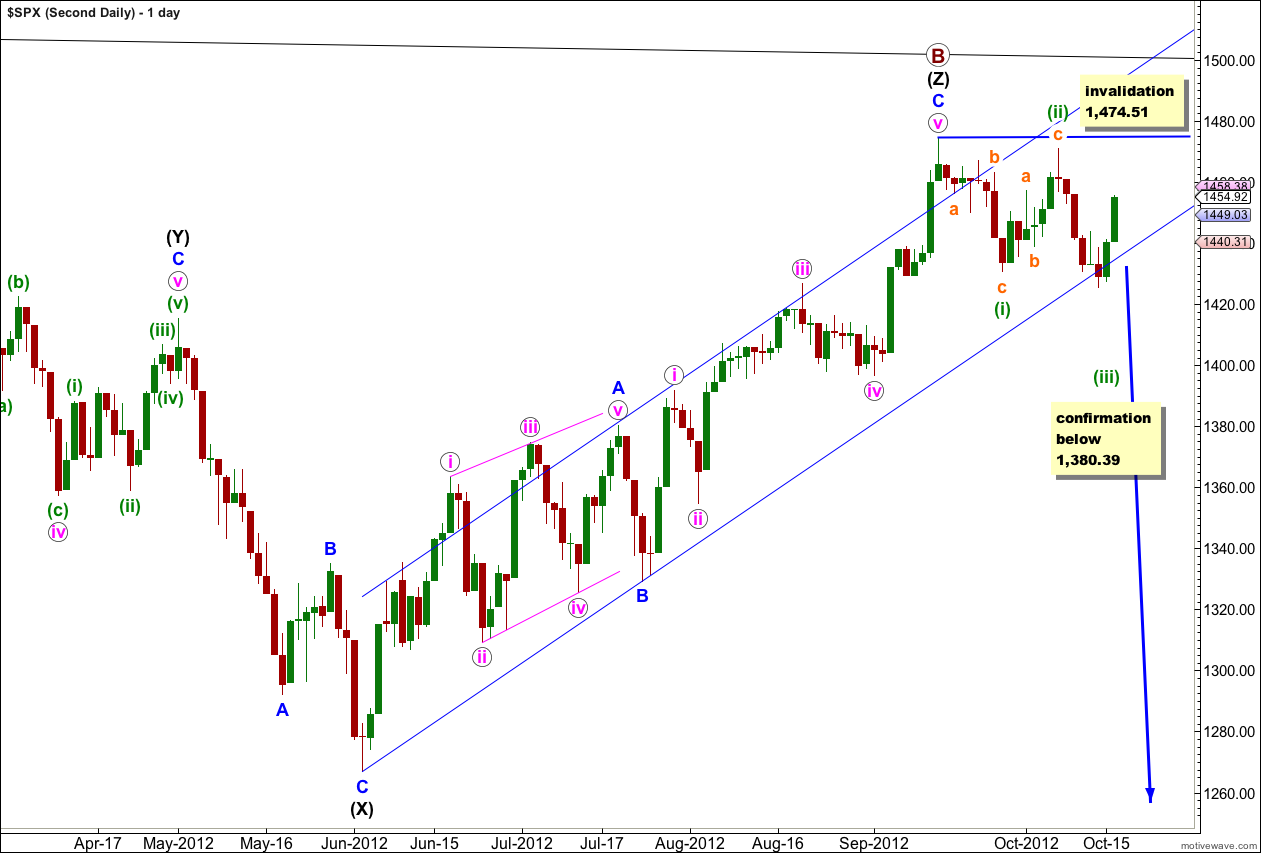
It remains possible that we have recently seen a major trend change in the S&P 500 and the DJIA. We should not place any confidence in this wave count prior to confirmation of a trend change with movement below 1,380.39.
We should always assume that the trend remains the same, until proven otherwise. At this stage we have absolutely no confirmation of a trend change. We will not have confirmation until price moves below 1,380.39 invalidating the first daily wave count.
Within the new downwards trend no second wave correction may move beyond the start of the first wave. This wave count is invalidated with any movement above 1,474.51.
If we are in a new downwards trend then it would be an unfolding leading diagonal. Wave (i) green subdivides into a zigzag, and wave (ii) green may also be seen as a zigzag.
Hi Lara,
Do you coordinate your views with Nady and Hugo because you are projecting a big upswing in the S&P as your primary count which is against their primary directions for the EUR/USD and GBP/USD?
No, I don’t. And when I did all three analyses myself I did not expect them to move together either.
I know this is an unpopular viewpoint, but Elliott wave theory states that each market is independent of the other. Therefore to use a pure EW approach one should not expect a downturn in the Euro to also mean the US stock market turns lower.
To see relationships between these markets is a fundamental approach which is mutually exclusive to Elliott wave.
NYMO http://scharts.co/R9J0lN pushing over the upper BB line within the next day or so we should have Wave (1) done 1470 goal.