
Last analysis expected more downwards movement to a short term target at 1,427 to 1,428. Price reached to 1,425.53 during Friday’s session, 1.47 points below the narrow target zone.
I have still the same two daily wave counts which differ at the monthly chart level and cycle degree. Members may review monthly charts here.
I have still the one same hourly wave count.
Click on the charts below to enlarge.
First Daily Wave Count.
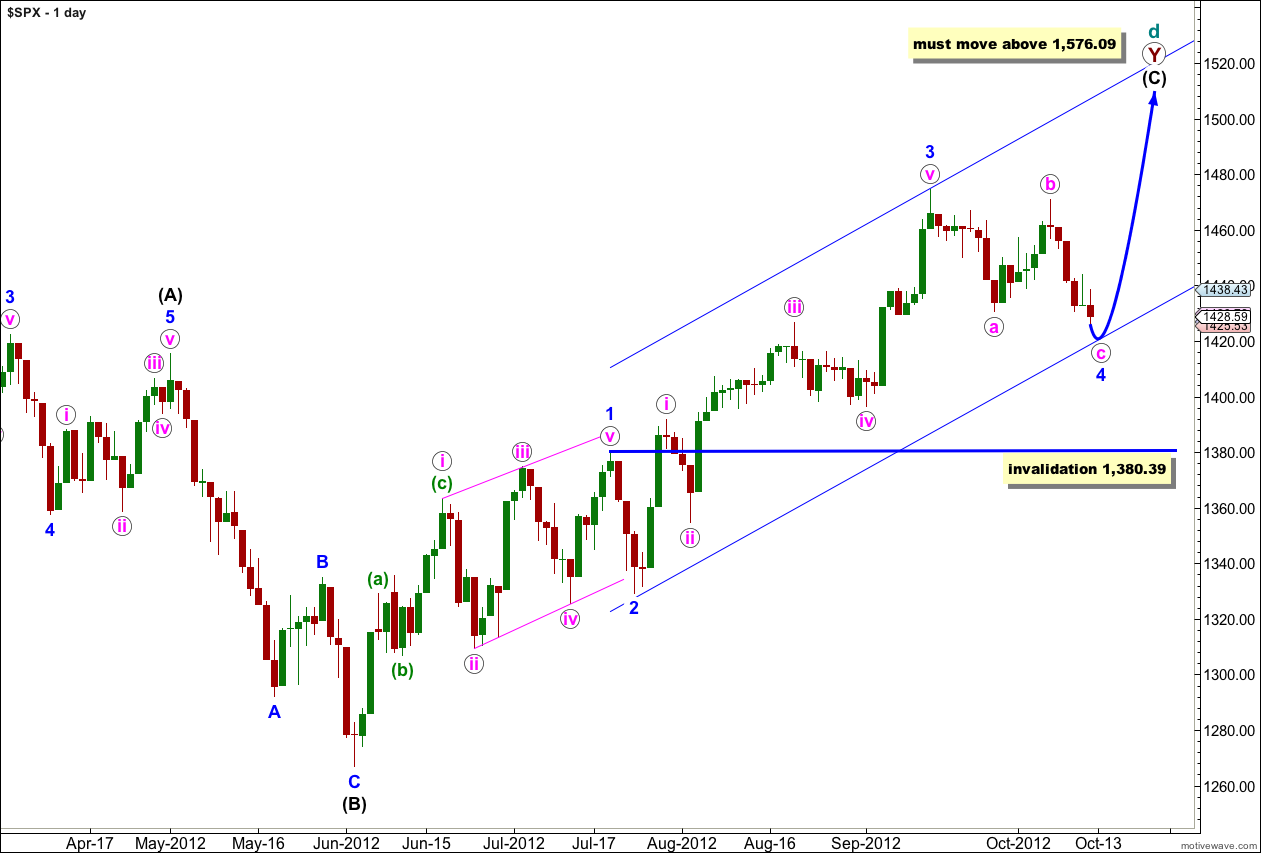
At super cycle degree this wave count sees a very rare expanding triangle unfolding, and cycle wave d upwards within the triangle is a double zigzag which must move beyond the end of cycle wave b.
Within the second zigzag of the double, primary wave Y, wave (C) black must unfold as a five wave structure.
Waves 1 through to 3 blue are complete. Wave 2 blue unfolded as a brief zigzag, and wave 4 blue looks like a flat correction exhibiting nice alternation. Wave c pink has moved to a new low below the end of wave a pink, avoiding a truncation.
Further downwards movement for wave 4 blue may not move into wave 1 blue price territory. This wave count is invalidated with movement below 1,380.39.
When Elliott’s first channeling technique is used about this impulse it does not work. The channel will have to be drawn correctly when wave 4 blue is complete.
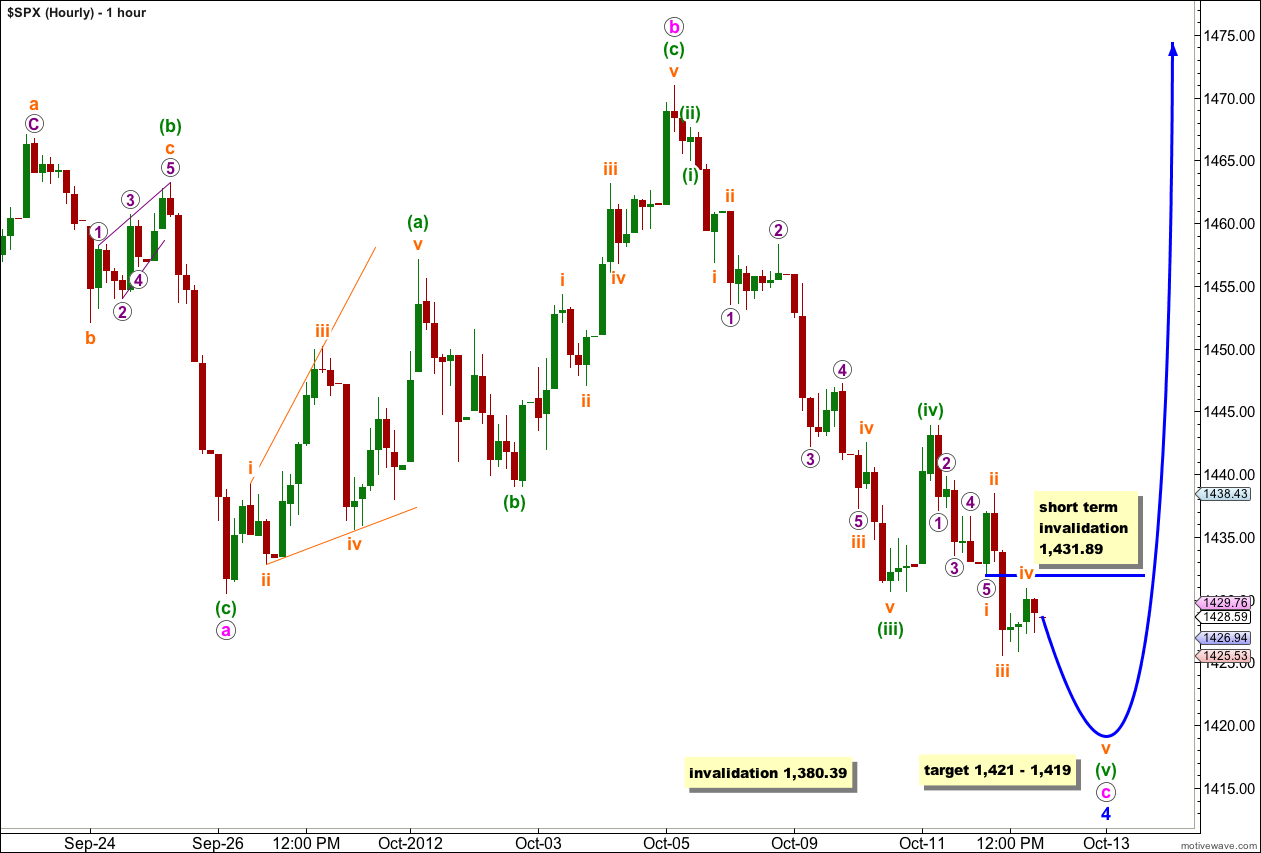
Although the target from last analysis at 1,427 to 1,428 has been reached and slightly passed, the structure within wave c pink remains incomplete.
It needs one final small fifth wave for wave v orange within (v) green to complete the structure. This wave may end during Monday’s session, or it could take price lower into Tuesday’s session.
At 1,421 wave (v) green would reach 0.618 the length of wave (iii) green.
At 1,419 wave v orange within wave (v) green would reach equality with wave i orange.
In the short term any further upwards movement of wave iv orange may not move into wave i orange price territory. This wave count is invalidated with movement above 1,431.89 before wave v orange is complete.
Wave 4 blue may not move into wave 1 blue price territory. This wave count is invalidated with movement below 1,380.39.
Second Daily Wave Count.
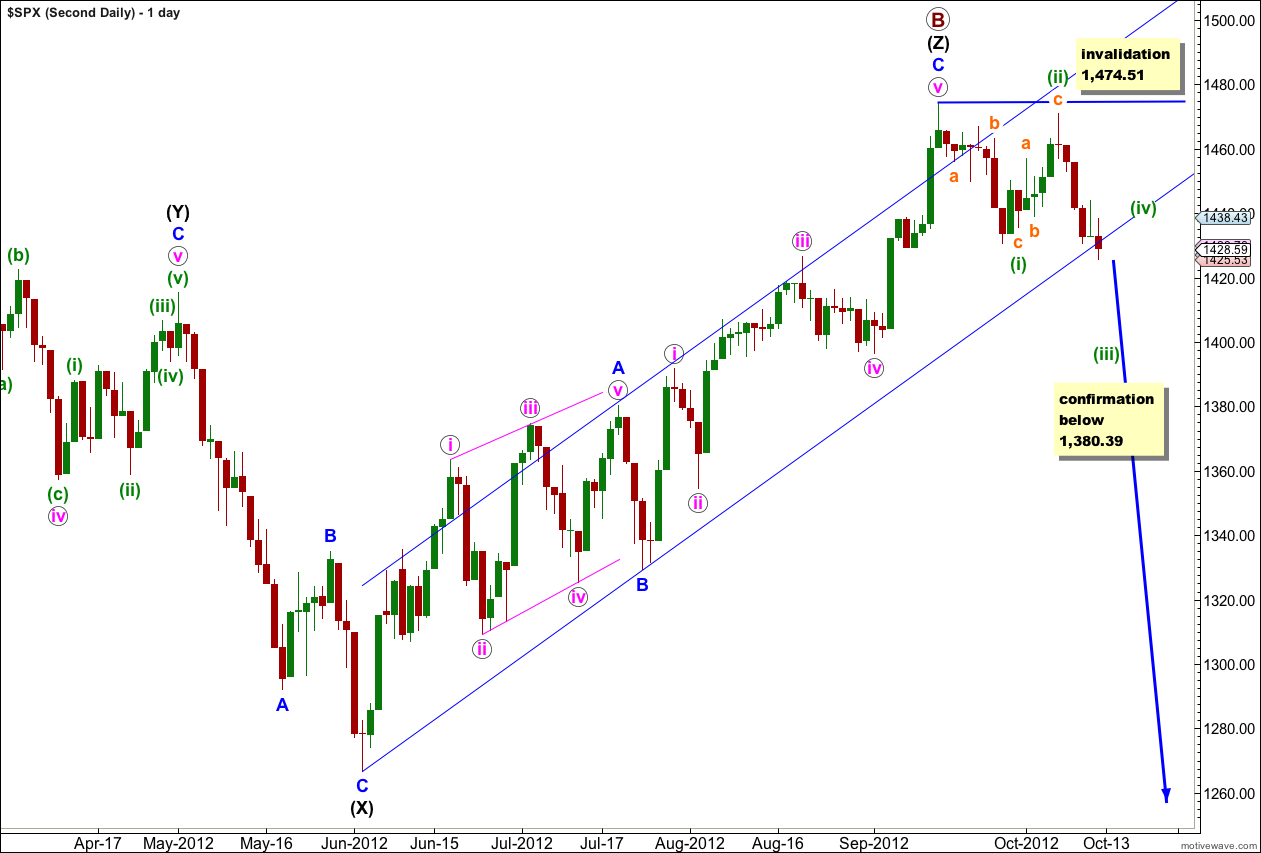
It remains possible but unlikely that we have recently seen a major trend change in the S&P 500 and the DJIA.
We should always assume that the trend remains the same, until proven otherwise. At this stage we have absolutely no confirmation of a trend change. We will not have confirmation until price moves below 1,380.39 invalidating the main wave count.
I publish this chart so that we aware of this possibility. We should not rely upon it without confirmation.
Within the new downwards trend no second wave correction may move beyond the start of the first wave. This wave count is invalidated with any movement above 1,474.51.
I can see a possibility of this wave count working for the Dow, but it does not have a very good look.
If we are in a new downwards trend then it would be an unfolding leading diagonal. Wave (i) green subdivides into a zigzag, and wave (ii) green may also be seen as a zigzag.
Lara,
on your Day chart above you state it must move beyond 1576. What do you mean by that?
Because for the first daily wave count the structure at cycle and super cycle degree is an expanding triangle, and within that expanding triangle wave d is unfolding. For an expanding triangle wave d must move beyond the end of wave b.
To see this structure look at the historic monthly chart for the first wave count. There is a link every day in the analysis.
The second wave count does not require an all time new high.
Please comment on this:
http://eminiaddict.com/?p=5982
Thanks for sending that. It’s an extremely interesting channel, it works well for the second daily wave count, but it indicates a little more upwards movement first could be likely. I’ll take another look at the structure within the possible third zigzag of (Z) black to see if it could have one or two more small upwards waves to about 1,500. That’s where it would meet the upper edge of the parallel channel.