
Last analysis expected more downwards movement for Tuesday’s session to a short term target at 1,447. Price did move lower, and although the target was passed by 5.82 points price remains above the invalidation point and the wave count remains valid.
The wave counts remain the same with the same mid term target.
The first and second daily wave counts differ at cycle degree. You may review monthly charts here.
First and second daily wave counts have about an even probability.
Click on the charts below to enlarge.
First Daily Wave Count.
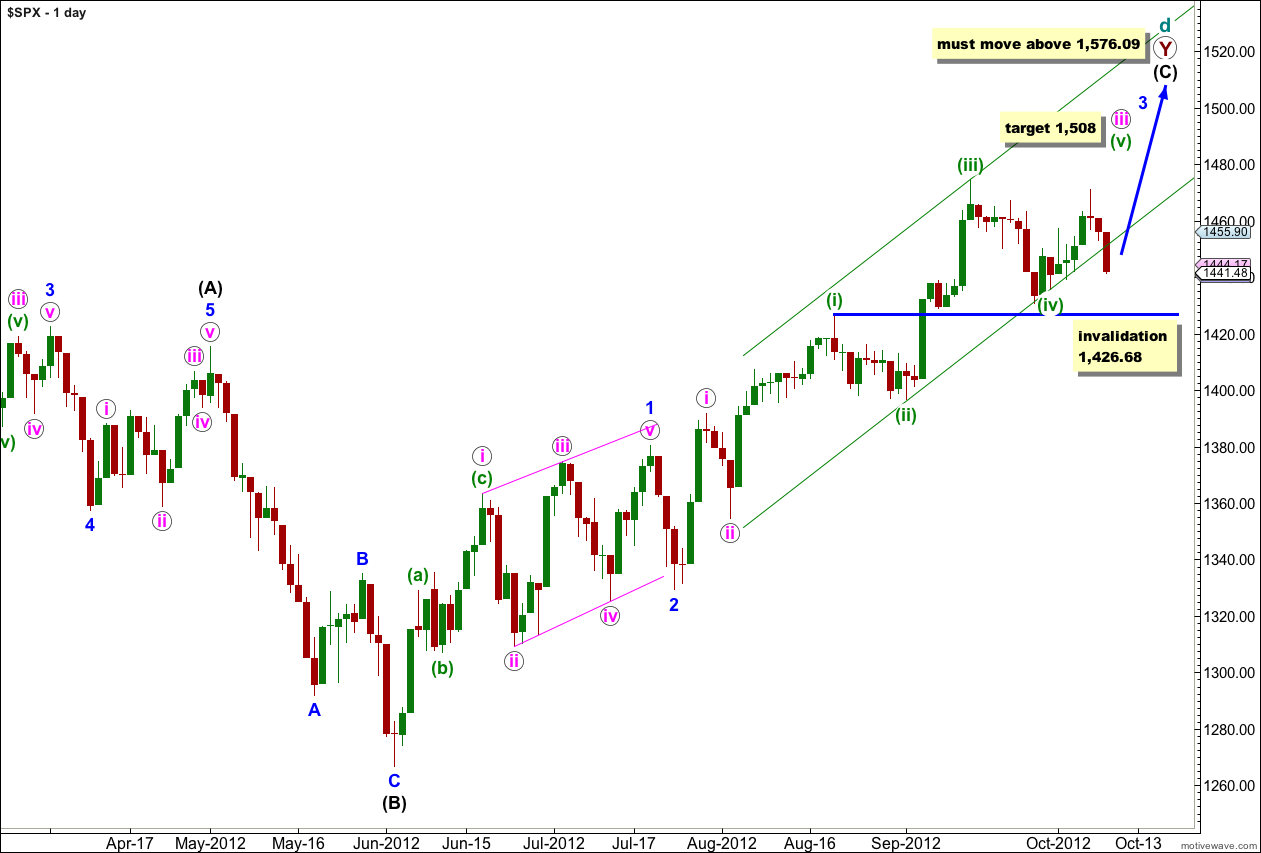
At super cycle degree this wave count sees a very rare expanding triangle unfolding, and cycle wave d upwards within the triangle is a double zigzag which must move beyond the end of cycle wave b.
Within the second zigzag of the double, primary wave Y, wave (C) black must unfold as a five wave structure.
Waves 1 and 2 blue are complete. At this stage wave 3 blue is unfolding upwards as an impulse and may have an extension in the middle of it.
When wave iii pink is complete we shall expect a correction for wave iv pink to last about a week or so.
When wave 3 blue is complete we shall expect a correction for wave 4 blue which should last about one to three weeks. At that stage this wave count will not expect price to move back into wave 1 blue price territory. The invalidation point would be at 1,380.39. The alternate below would expect price to move below this point. At that stage the wave counts would diverge and 1,380.39 is the price point which differentiates them.
Within wave iii pink at 1,508 wave (v) green would reach equality in length with wave (i) green.
Any further downwards movement for wave (iv) green may not move into wave (i) green price territory. This wave count is invalidated with movement below 1,426.68.
I have redrawn the parallel channel about wave iii pink. The first trend line is drawn from the lows of waves (ii) to (iv) green, then a parallel copy is placed upon the high of wave (iii) green.
First Daily Wave Count – Alternate.
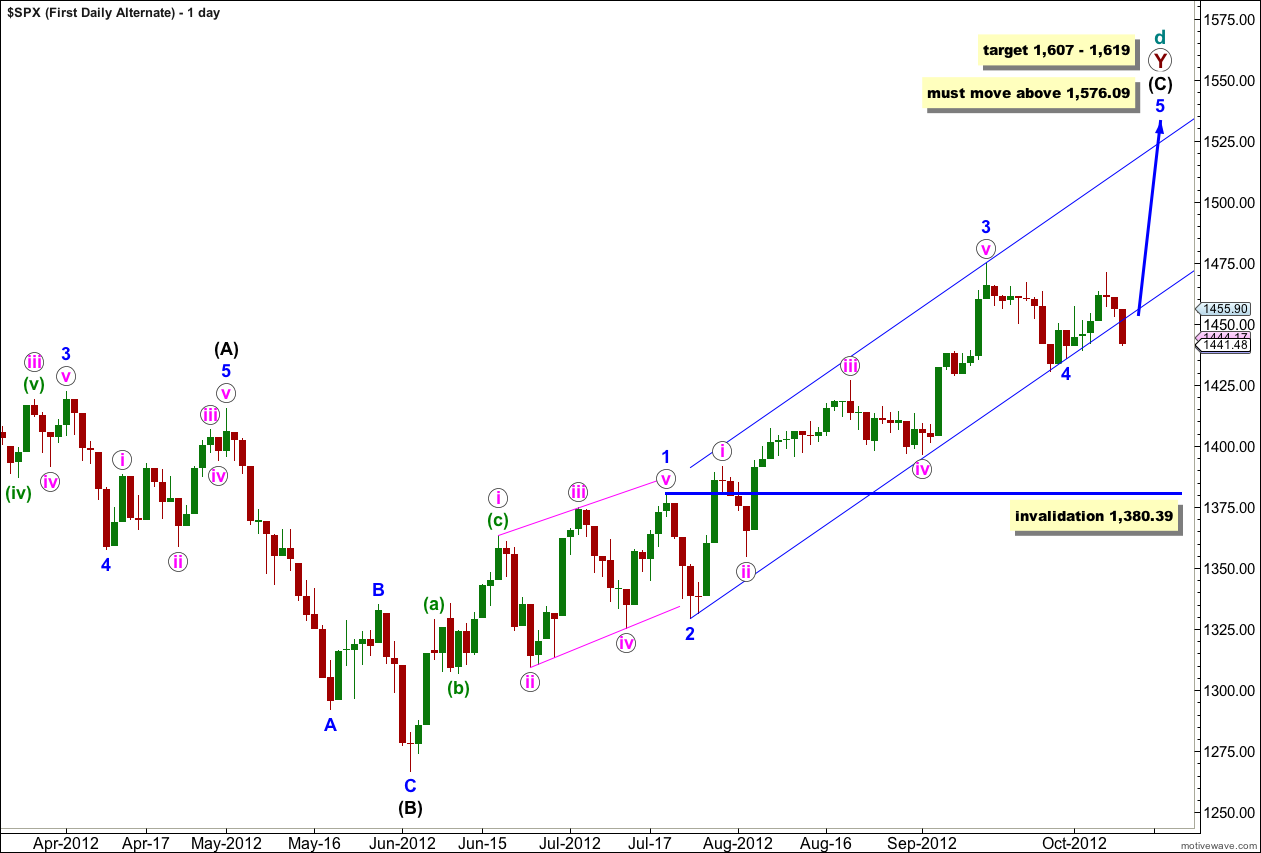
This is an alternate way of looking at upwards movement from the low labeled 2 blue. It is possible that wave 3 blue is a complete impulse and that downwards movement last week was wave 4 blue.
At this stage it is too early to confirm an end to the correction labeled 4 blue. If this correction continues further as a double or a flat then it may not move into wave 1 blue price territory. This wave count is invalidated with movement below 1,380.39.
Wave 3 blue has no Fibonacci ratio to wave 1 blue which means wave 5 blue is more likely to exhibit a Fibonacci ratio to either of 1 or 3 blue. At 1,619 wave 5 blue would reach 1.618 the length of wave 1 blue.
At 1,607 wave (C) black would reach equality in length with wave (A) black.
Wave (A) black lasted 145 days. Wave (C) black has so far lasted 89 days. Wave (C) black would reach equality in duration with wave (A) black in another 56 days.
This alternate has a lower probability because it does not work for the Dow. On the Dow there is too much overlapping for this idea to fit. I would expect the S&P 500 and the Dow to turn reasonably closely together, although they do not always do so, which is why I’m considering this alternate for the S&P 500.
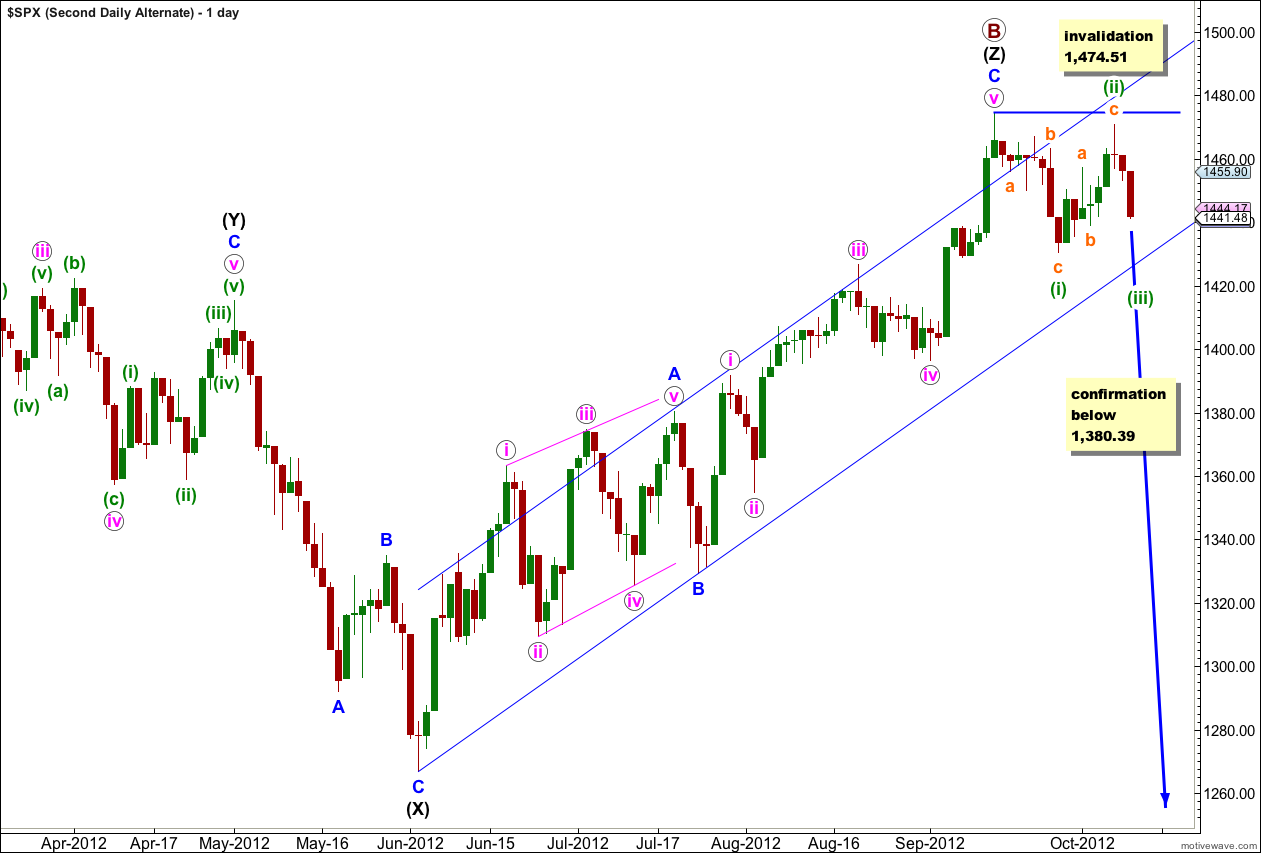
Second Daily Wave Count.
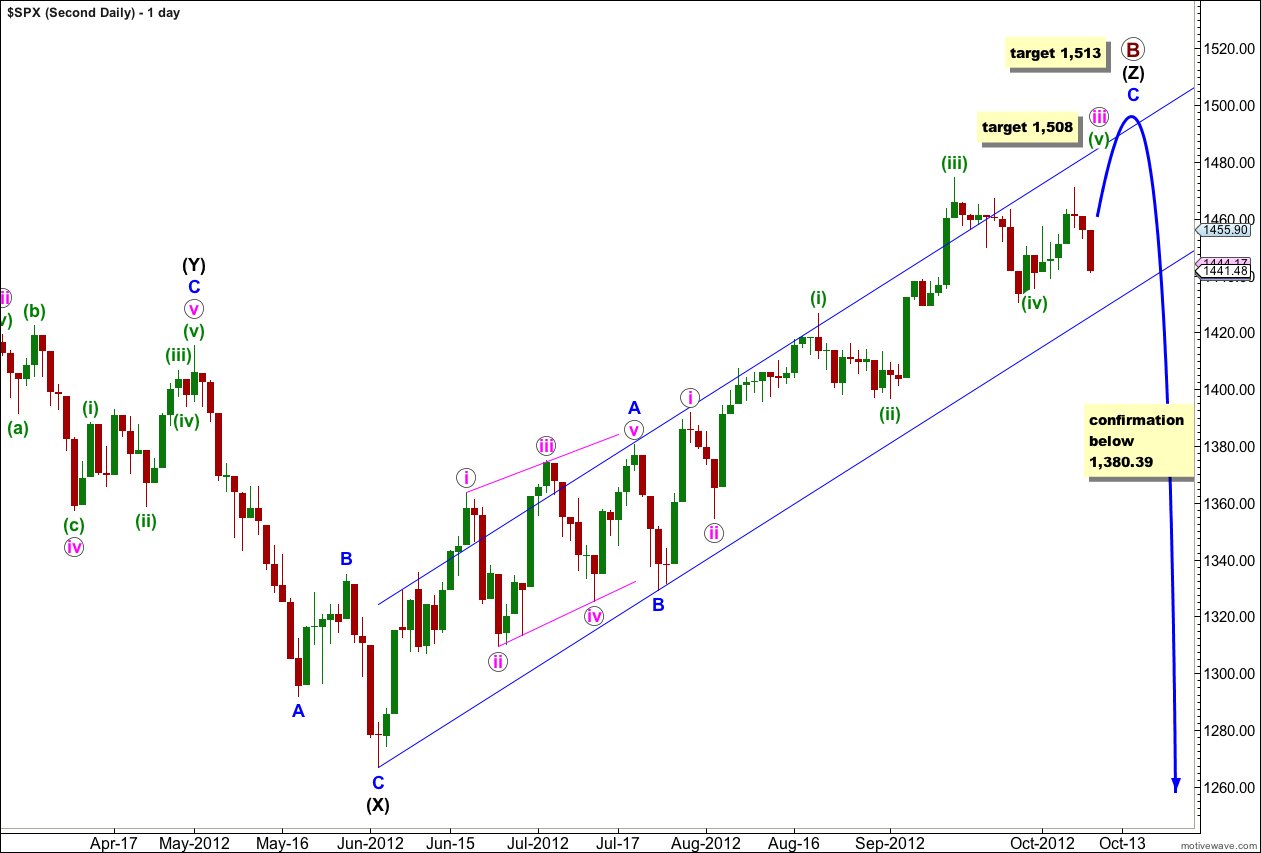
At grand super cycle degree this wave count sees a double flat correction unfolding, which is a common structure. The second flat in the double has begun. Within a flat the A wave must subdivide into a three wave structure, so here at cycle degree a three wave flat is unfolding. Within cycle wave a primary wave A is complete and primary wave B may be incomplete.
Primary wave B is already longer than the maximum common length in relation to primary wave A, 138%. As primary wave B moves higher and is even longer in relation to primary wave A the probability of this wave count will continue to reduce. This is why it has a probability which is about even with the first daily wave count.
At 1,508 wave (v) green would reach equality in length with wave (i) green.
Thereafter, a fourth wave correction for wave iv pink should last about a week or so.
Further upwards movement for wave v pink would complete this wave count at all degrees. At 1,513 wave C blue would reach 1.618 the length of wave A blue.
Thereafter, movement below 1,380.39 would take price back into what is wave 1 blue price territory for the first monthly wave count, and that would tip the balance in favour of this second wave count.
Hourly Wave Count.
This hourly wave count is the same for all three daily wave counts above, only the degree of labeling may differ.
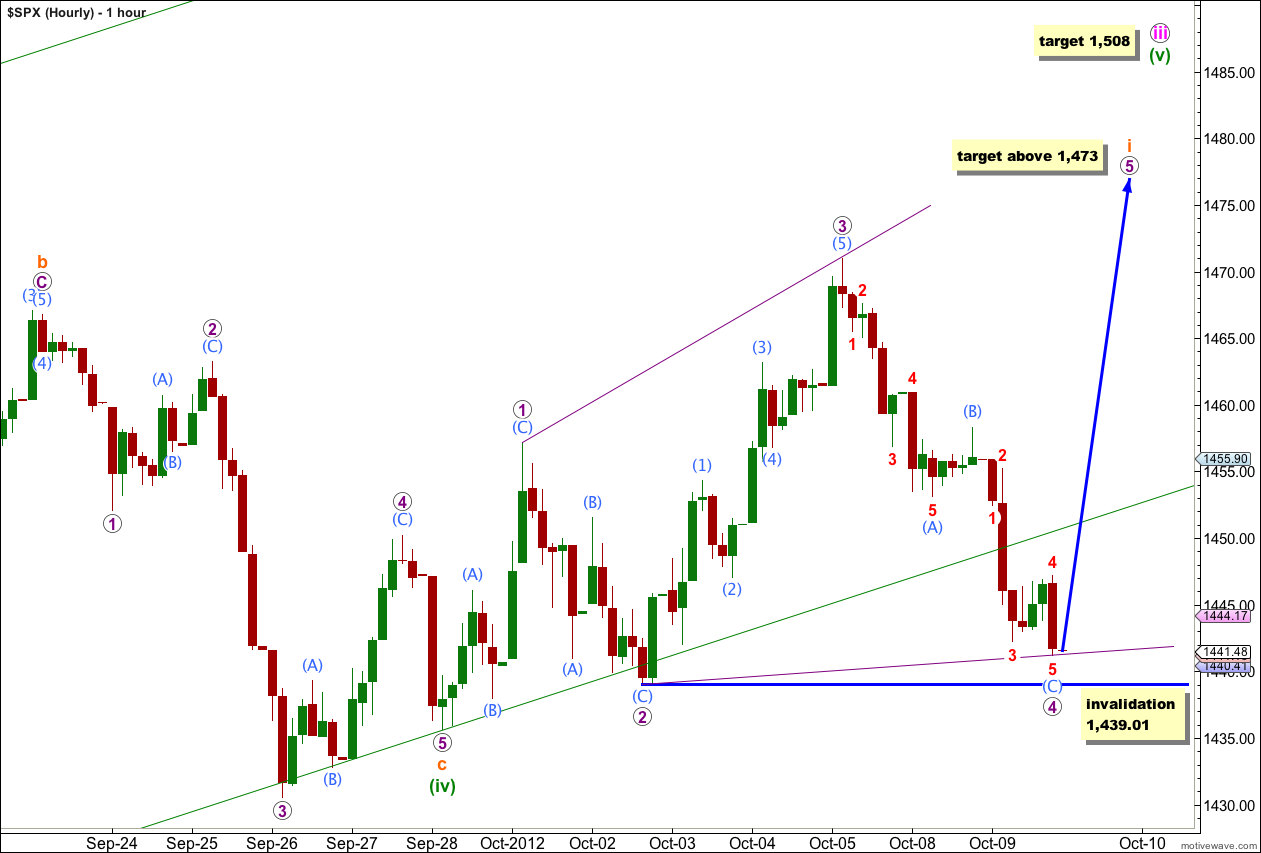
Wave 4 purple is now 93% the length of wave 3 purple, which is longer than the common length of 88%, but it remains valid.
So far wave 4 purple subdivides into a zigzag nicely on the 5 minute chart. There is not enough upwards movement at the end of Tuesday’s session to confirm that wave 5 red is over. It could move a little lower early tomorrow.
If wave 4 purple is over then wave 5 purple would reach equality with wave 3 purple at 1,473. It should reach this length as the diagonal is expanding.
For a leading diagonal the fifth wave may not be truncated. Wave 5 purple must take price above 1,470.96.
Wave 4 purple may not move beyond the end of wave 2 purple. This wave count is invalidated with movement below 1,439.01. If this wave count is invalidated tomorrow then we may use the alternate below.
Hourly Wave Count – Alternate.
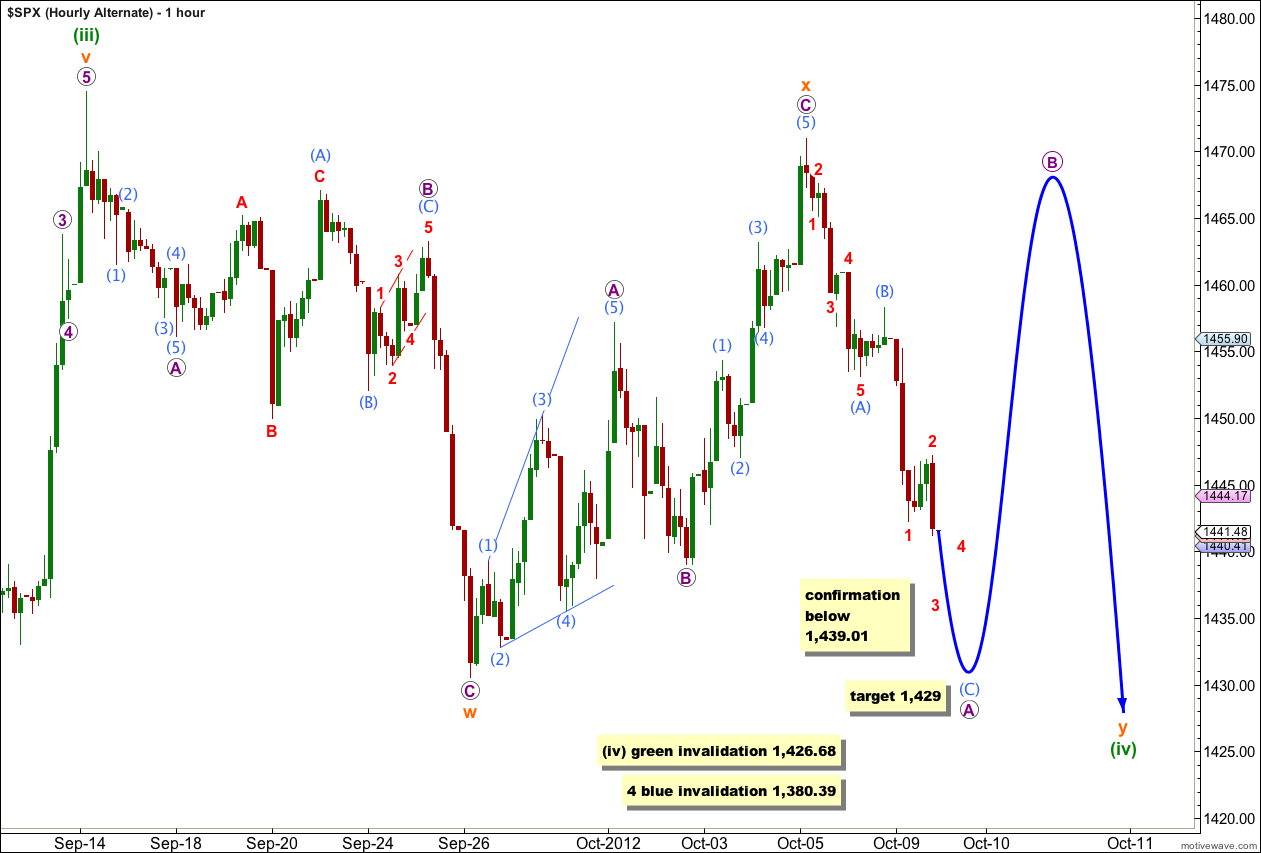
It is possible that this fourth wave correction is not over, although if it were to continue as a double zigzag or double combination it would be out of proportion to all the other corrections so far on the way up.
Movement below 1,439.01 would confirm this less likely wave count.
At that stage we would expect the continuation of a second corrective structure for wave y orange, most likely a flat correction.
At 1,429 wave (C) aqua would reach 1.618 the length of wave (A) aqua.
This fourth wave correction may be either at green degree or blue degree. Wave (iv) green may not move into wave (i) green price territory. This wave count would be invalidated with movement below 1,426.68.
If price moved below 1,426.68 then the correction may be at blue degree (first daily wave count – alternate). Wave 4 blue may not move into wave 1 blue price territory. This wave count would be invalidated with movement below 1,380.39.
Second Daily Wave Count – Alternate.
It remains possible, but unlikely, that primary wave B is over and we have recently seen a large trend change.
We should always assume that the trend remains the same, until proven otherwise. At this stage we have absolutely no confirmation of a trend change. We will not have confirmation until price moves below 1,380.39 invalidating the main wave count.
I publish this chart so that we aware of this possibility. We should not rely upon it without confirmation.
Within the new downwards trend no second wave correction may move beyond the start of the first wave. This wave count is invalidated with any movement above 1,474.51.
This wave count does not work for the Dow as far as I have been able to see.
If we are in a new downwards trend then it would be an unfolding leading diagonal. Wave (i) green subdivides into a zigzag, and wave (ii) green may also be seen as a zigzag. Wave (iii) green must make a new low below the end of wave (i) green.
Lara,
As of 21:00 hrs UK time, it looks like we have seen an impulse wave down and we are now in a corrective flat?
Possibly, although I’m having difficulty seeing the C wave down work as an impulse. It looks like an impulse but when I label it as such the third wave is too short. If it’s an impulse it needs more downwards movement.
It could also be an unfolding zigzag as I had labeled yesterday.