
Last analysis expected further upwards movement for Friday’s session, which is overall what has happened.
I have the same two daily wave counts, each with its alternate, and now only one hourly wave count for you.
The two daily wave counts differ at the monthly chart level. You may review monthly charts here.
Click on the charts below to enlarge.
First Daily Wave Count.
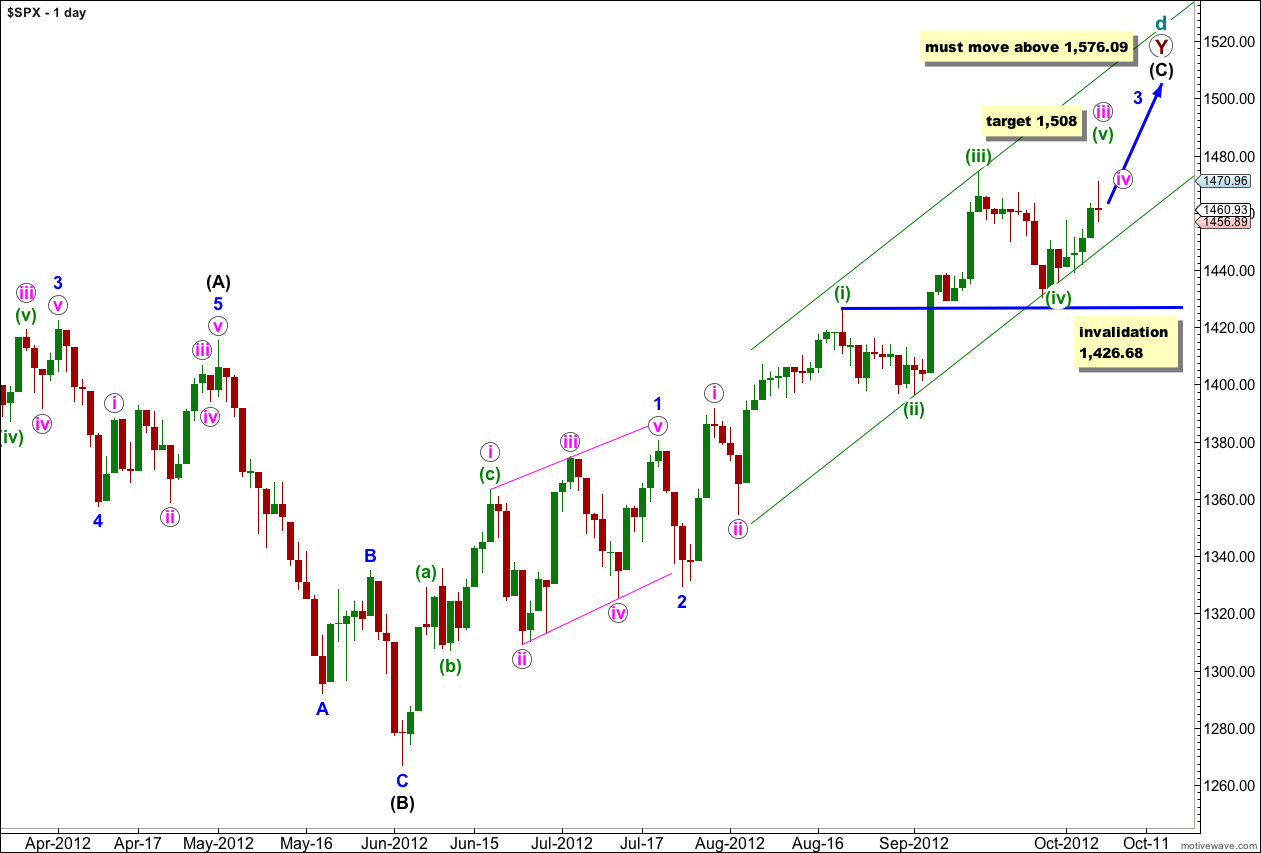
At super cycle degree this wave count sees a very rare expanding triangle unfolding, and cycle wave d upwards within the triangle is a double zigzag which must move beyond the end of cycle wave b.
Within the second zigzag of the double, primary wave Y, wave (C) black must unfold as a five wave structure.
Waves 1 and 2 blue are complete. At this stage wave 3 blue is unfolding upwards as an impulse and may have an extension in the middle of it.
When wave iii pink is complete we shall expect a correction for wave iv pink to last about a week or so.
When wave 3 blue is complete we shall expect a correction for wave 4 blue which should last about one to three weeks. At that stage this wave count will not expect price to move back into wave 1 blue price territory. The invalidation point would be at 1,380.39. The alternate below would expect price to move below this point. At that stage the wave counts would diverge and 1,380.39 is the price point which differentiates them.
Within wave iii pink at 1,508 wave (v) green would reach equality in length with wave (i) green.
Any further downwards movement for wave (iv) green may not move into wave (i) green price territory. This wave count is invalidated with movement below 1,426.68.
I have redrawn the parallel channel about wave iii pink. The first trend line is drawn from the lows of waves (ii) to (iv) green, then a parallel copy is placed upon the high of wave (iii) green.
First Daily Wave Count – Alternate.
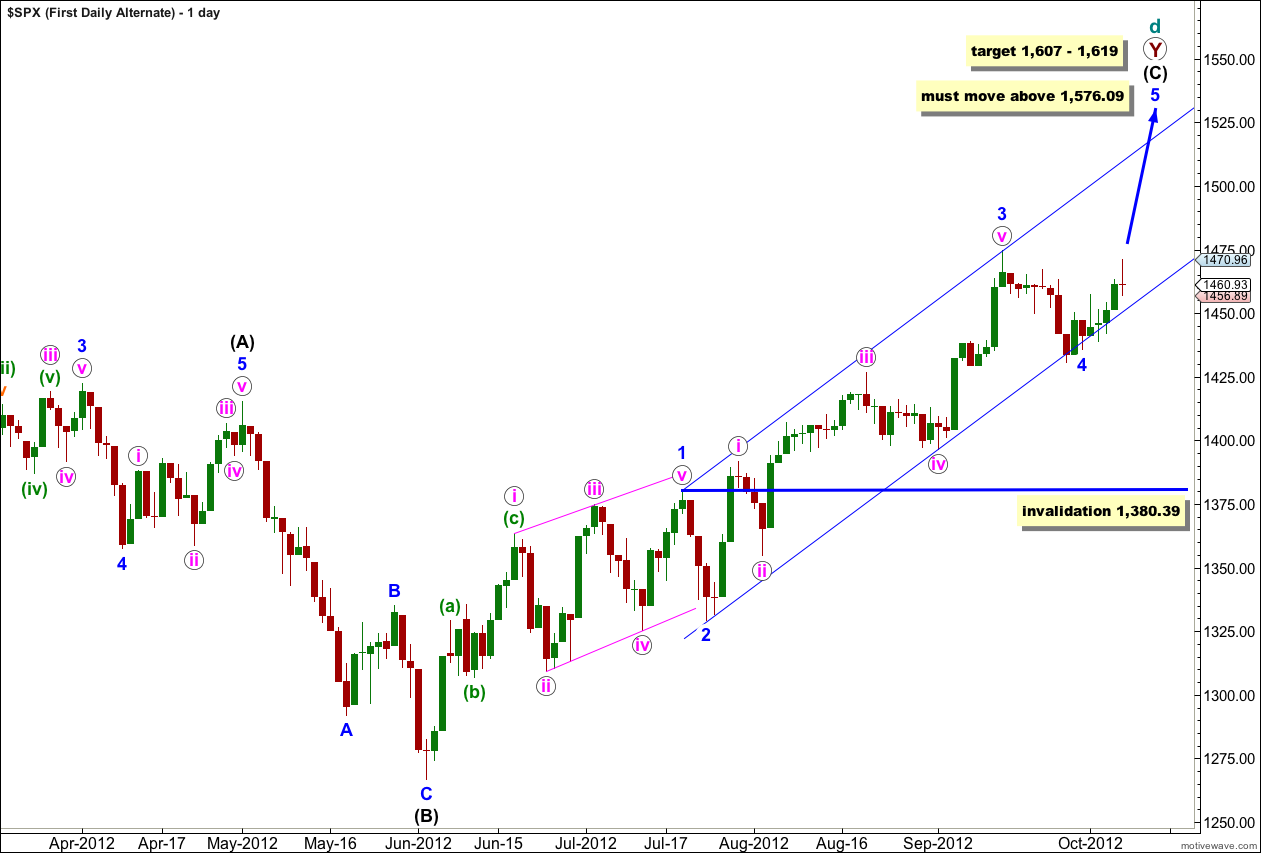
This is an alternate way of looking at upwards movement from the low labeled 2 blue. It is possible that wave 3 blue is a complete impulse and that downwards movement this week is wave 4 blue.
At this stage it is too early to confirm an end to the correction labeled 4 blue. If this correction continues further as a double or a flat then it may not move into wave 1 blue price territory. This wave count is invalidated with movement below 1,380.39.
Wave 3 blue has no Fibonacci ratio to wave 1 blue which means wave 5 blue is more likely to exhibit a Fibonacci ratio to either of 1 or 3 blue. At 1,619 wave 5 blue would reach 1.618 the length of wave 1 blue.
At 1,607 wave (C) black would reach equality in length with wave (A) black.
Wave (A) black lasted 145 days. Wave (C) black has so far lasted 87 days. Wave (C) black would reach equality in duration with wave (A) black in another 58 days.
This alternate has a lower probability because it does not work for the Dow. On the Dow there is too much overlapping for this idea to fit. I would expect the S&P 500 and the Dow to turn reasonably closely together, although they do not always do so, which is why I’m considering this alternate for the S&P 500.
Second Daily Wave Count.
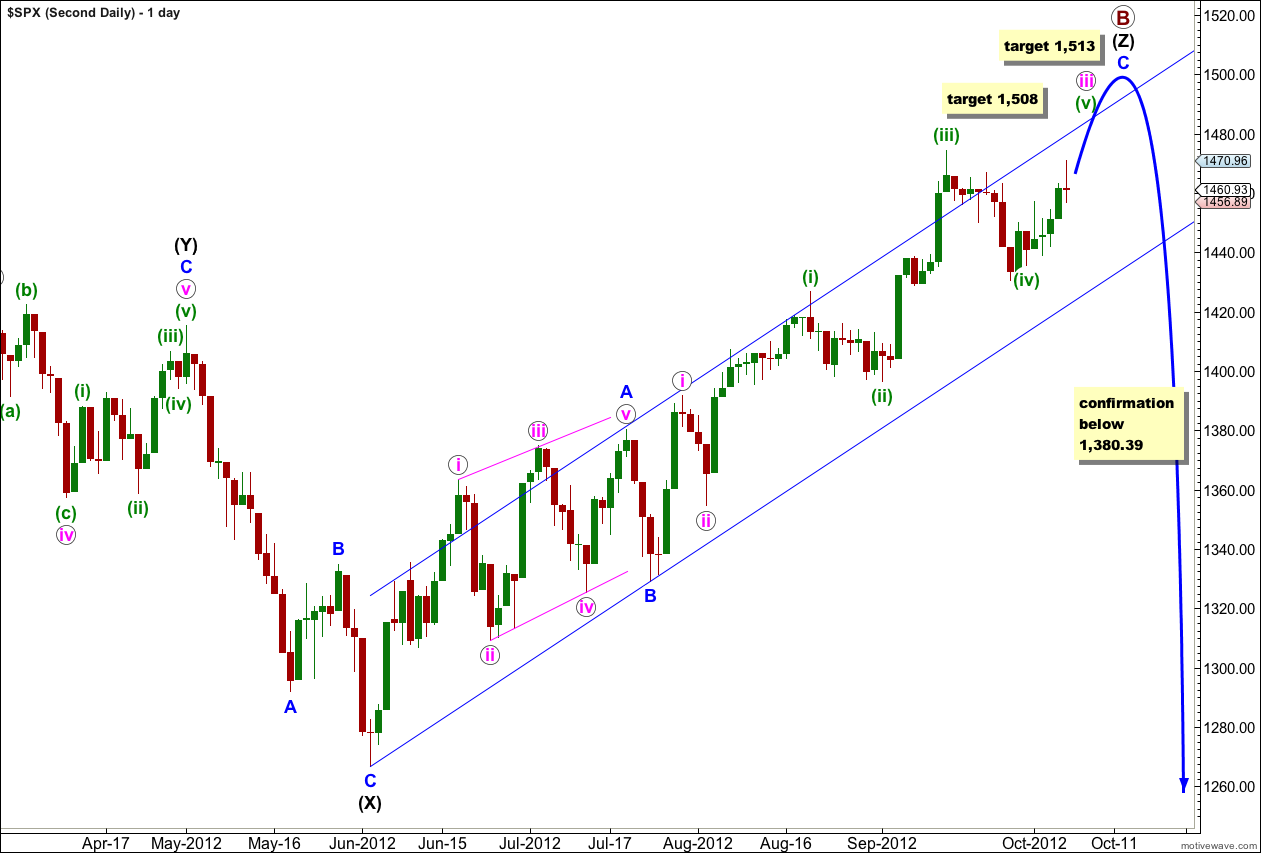
At grand super cycle degree this wave count sees a double flat correction unfolding, which is a common structure. The second flat in the double has begun. Within a flat the A wave must subdivide into a three wave structure, so here at cycle degree a three wave flat is unfolding. Within cycle wave a primary wave A is complete and primary wave B may be incomplete.
At 1,508 wave (v) green would reach equality in length with wave (i) green.
Thereafter, a fourth wave correction for wave iv pink should last about a week or so.
Further upwards movement for wave v pink would complete this wave count at all degrees. At 1,513 wave C blue would reach 1.618 the length of wave A blue.
Thereafter, movement below 1,380.39 would take price back into what is wave 1 blue price territory for the first monthly wave count, and that would tip the balance in favour of this second wave count.
Hourly Wave Count.
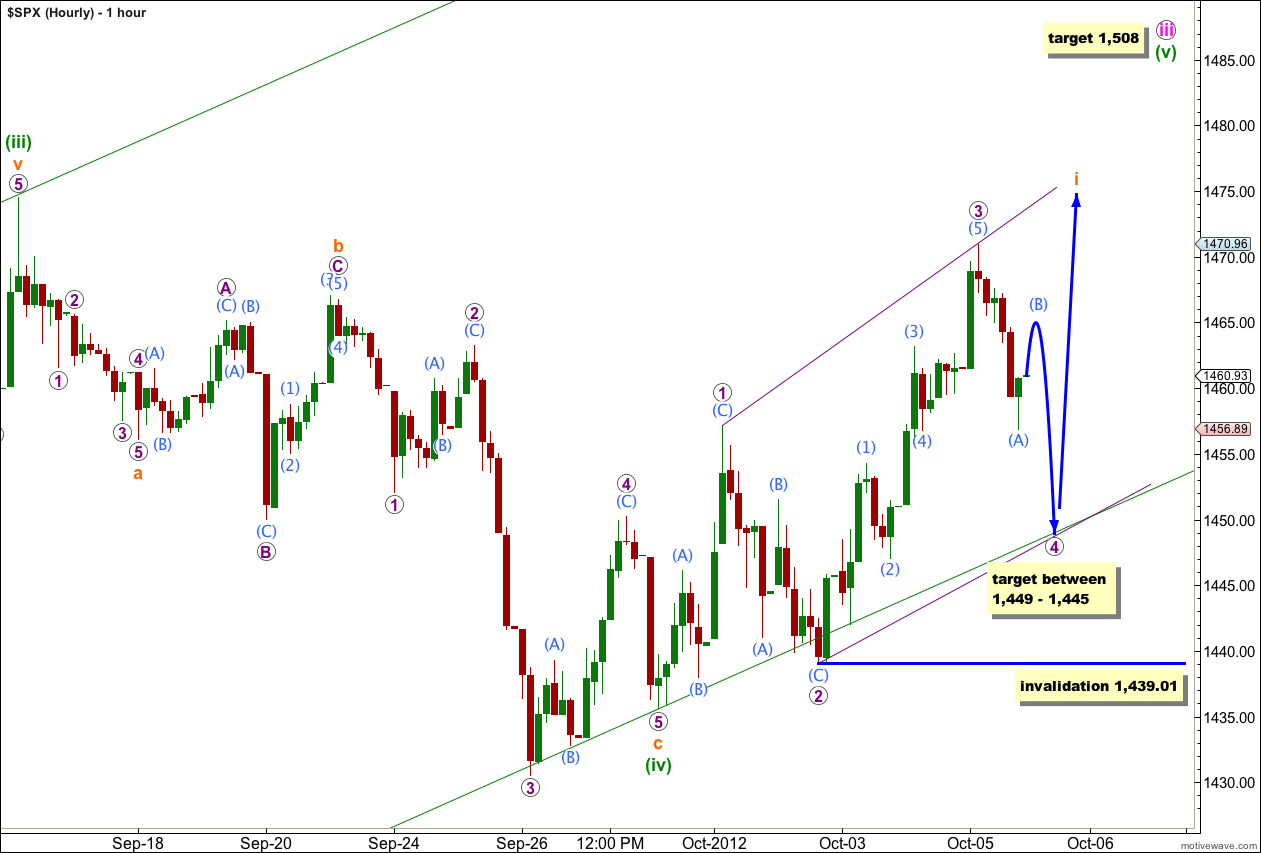
With movement slightly below 1,448.09 (the high labeled wave 1 purple) it looks most like wave i orange upwards is subdividing as a leading diagonal.
Wave 1 purple subdivides into a zigzag. Wave 3 purple subdivides as an impulse. Wave 4 purple must subdivide into a zigzag and so far it is incomplete. Wave (A) aqua is a complete five wave impulse. Wave (B) aqua should move price higher early during Monday’s session. Thereafter, wave (C) aqua should make a new low below the end of wave (A) aqua.
Wave 4 purple should be longer than wave 2 purple as this diagonal is expanding. Wave 4 purple would be expected to be about 0.81 to 0.66 the length of wave 3 purple. This would take price to between 1,449 – 1,445.
Wave 4 purple must overlap into wave 1 price territory, which is does so far. Wave 4 of a diagonal may not move beyond the end of wave 2. This wave count is invalidated with movement below 1,439.01.
Second Daily Wave Count – Alternate.
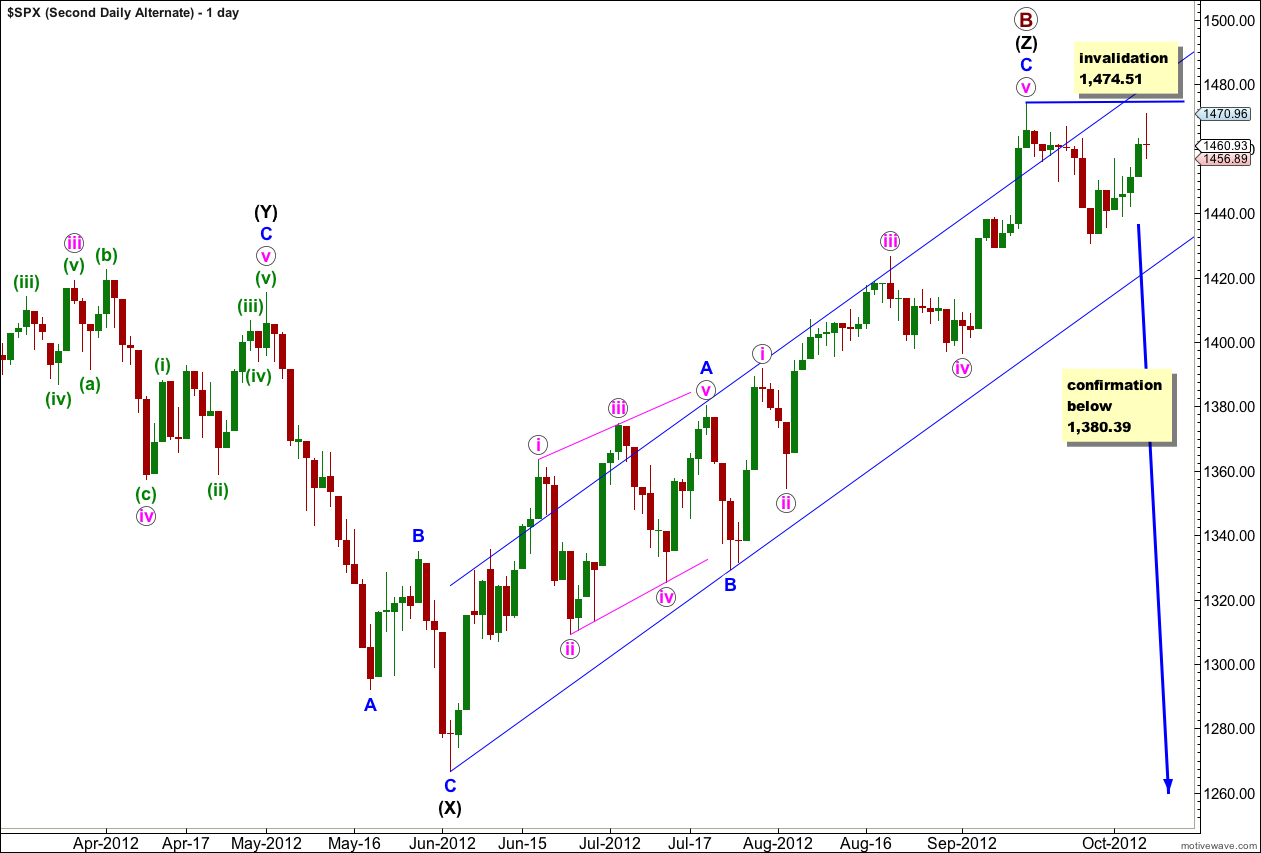
It remains possible, but unlikely, that primary wave B is over and we have recently seen a large trend change.
We should always assume that the trend remains the same, until proven otherwise. At this stage we have absolutely no confirmation of a trend change. We will not have confirmation until price moves below 1,380.39 invalidating the main wave count.
I publish this chart so that we aware of this possibility. We should not rely upon it without confirmation.
Within the new downwards trend no second wave correction may move beyond the start of the first wave. This wave count is invalidated with any movement above 1,474.51.
Not only does this wave count not work for the Dow but it does not work on the hourly chart level either. Downwards movement does not subdivide as either an impulse or a leading diagonal, the only two possible structures for a first wave.
Thanks for the detailed response. My description of it being as a triple zigzag was just wrong. Labelling wrong also as you pointed put. The overall 53535 structure looks to be the pattern though but it is not an impulse, not a diagonal. The fibonacci is good and it channels well. Just don’t know what it is. Got to be a correction of some type and only correction of the 53535 type is zigzag.
Thanks for feedback. Have been working on it based on your comments and may send E mail to you offline about it (:-)
You’re right, it’s not an impulse nor a diagonal (unless it’s the start of an impulse with a third wave extension – see my alternate monthly chart).
What 5-3-5-3-5 subdivides to (when there is overlapping) is A-B-C-X-A-
…which would then require another B-C to complete a double zigzag.
Hi Lara, You mention that a completed Primary B count for SPX is inconsistent with the Dow. I may very well be wrong but would be interested in what you think invalidates a triple ZZ count for the DOW as per the chart (or similar) in the link below.
Thanks for your thoughts.
http://twitpic.com/b1v6k1/full
I know the wave Z has overlapping wave 4 with 1 and not looking like a 33333 ending diagonal. Just not sure what EW rules might apply here. Thanks!
Nope, it’s not an ending diagonal at all. The wave lengths are wrong also.
Ending diagonals have to have each subwave as a zigzag and this should be clear.
There are a few problems with that wave count. Within a triple zigzag each zigzag (W, Y and Z) subdivide into A-B-C zigzags. This wave count has them labeled as five wave structures which is incorrect.
Change the W to A, the 1st X to B and the Y to C. That first movement is W, a zigzag. The 2nd X becomes the 1st X.
The second zigzag ends at the high you have labeled 3 within Z. 4 within Z becomes the 2nd X. We would be within the third Z wave.
However, overall you cannot have an X wave which itself subdivides into a double or triple. X waves must subdivide into a single three, most commonly a zigzag. If you were to allow X waves to themselves subdivide into multiples then you have multiples within multiples which is just wrong. So your big label of X red cannot be correct; if this is a multiple then it is not an X wave.