
Last analysis expected upwards movement overall for Monday’s session which is what we have seen.
I have the same two daily wave counts which still have about an even probability. They both expect the same direction for the next couple of weeks or so.
I have only one hourly chart for you today which will suffice for both daily charts.
Click on the charts below to enlarge.
First Daily Wave Count.
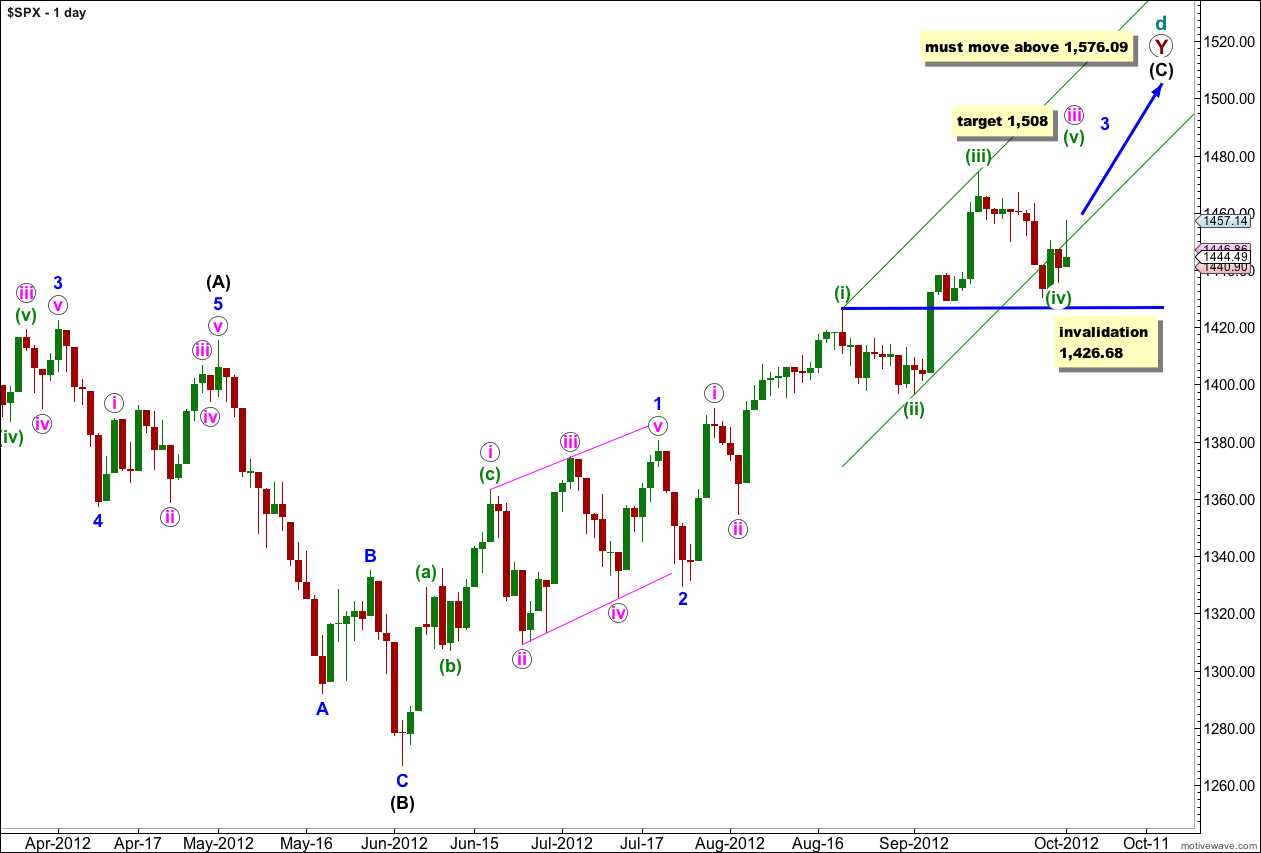
At super cycle degree this wave count sees a very rare expanding triangle unfolding, and cycle wave d upwards within the triangle is a double zigzag which must move beyond the end of cycle wave b.
Within the second zigzag of the double, primary wave Y, wave (C) black must unfold as a five wave structure.
Waves 1 and 2 blue are complete. At this stage wave 3 blue is unfolding upwards as an impulse and may have an extension in the middle of it.
When wave iii pink is complete we shall expect a correction for wave iv pink to last about a week or so.
When wave 3 blue is complete we shall expect a correction for wave 4 blue which should last about one to three weeks. At that stage this wave count will not expect price to move back into wave 1 blue price territory. The invalidation point would be at 1,380.39. The alternate below would expect price to move below this point. At that stage the wave counts would diverge and 1,380.39 is the price point which differentiates them.
Within wave iii pink at 1,508 wave (v) green would reach equality in length with wave (i) green.
Any further downwards movement for wave (iv) green may not move into wave (i) green price territory. This wave count is invalidated with movement below 1,426.68.
First Daily Wave Count – Alternate.
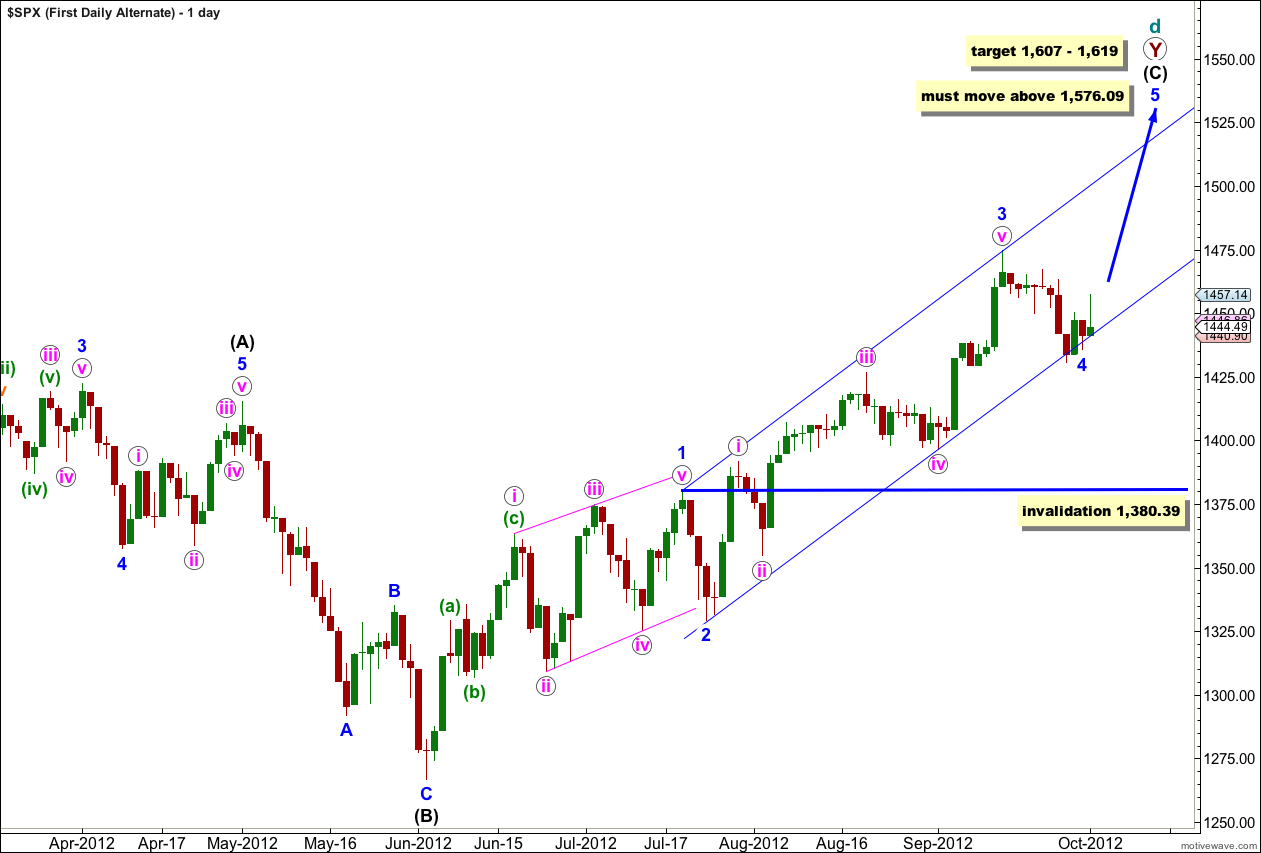
This is an alternate way of looking at upwards movement from the low labeled 2 blue. It is possible that wave 3 blue is a complete impulse and that downwards movement this week is wave 4 blue.
At this stage it is too early to confirm an end to the correction labeled 4 blue. If this correction continues further as a double or a flat then it may not move into wave 1 blue price territory. This wave count is invalidated with movement below 1,380.39.
Wave 3 blue has no Fibonacci ratio to wave 1 blue which means wave 5 blue is more likely to exhibit a Fibonacci ratio to either of 1 or 3 blue. At 1,619 wave 5 blue would reach 1.618 the length of wave 1 blue.
At 1,607 wave (C) black would reach equality in length with wave (A) black.
Wave (A) black lasted 164 days. Wave (C) black has so far lasted 83 days. Wave (C) black would reach equality in duration with wave (A) black in another 81 days.
This alternate has a lower probability because it does not work for the Dow. On the Dow there is too much overlapping for this idea to fit. I would expect the S&P 500 and the Dow to turn reasonably closely together, although they do not always do so, which is why I’m considering this alternate for the S&P 500.
Hourly Wave Count.
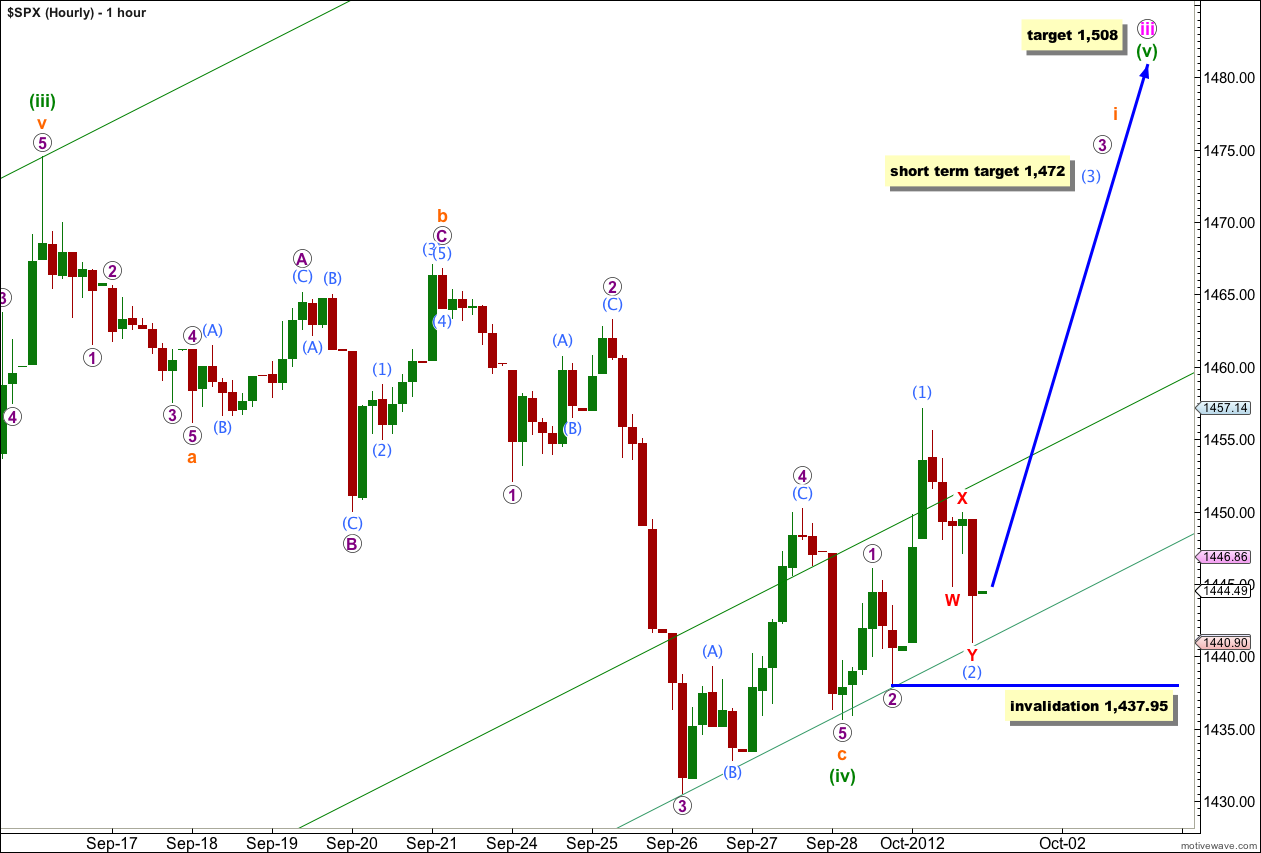
This hourly wave count was yesterday’s alternate. Today it is the only wave count I can see at the hourly chart level in which all subdivisions fit.
Because the downwards wave labeled here wave 5 purple of wave c orange of wave (iv) green subdivides perfectly on the 5 minute and 1 minute charts as an impulse, it may have been a truncated fifth wave to end wave c orange. This movement does not subdivide as a three and it cannot be a complete correction.
From the end of wave (iv) green we have so far two upward impulses each followed by a correction downwards. This is most likely to be a pair of first and second waves. This indicates an increase in upwards momentum tomorrow as a low degree third wave of a third wave unfolds upwards.
At 1,472 wave (3) aqua would reach 1.618 the length of wave (1) aqua.
Any further downwards movement of wave (2) aqua may not move beyond the start of wave (1) aqua. This wave count is invalidated with movement below 1,437.95.
I have created another parallel copy of the lower edge of the parallel trend channel drawn on the daily chart and copied over here to the hourly chart. It looks like downwards movement is finding support at this parallel trend line. It should continue to do so on the way up.
Second Daily Wave Count.
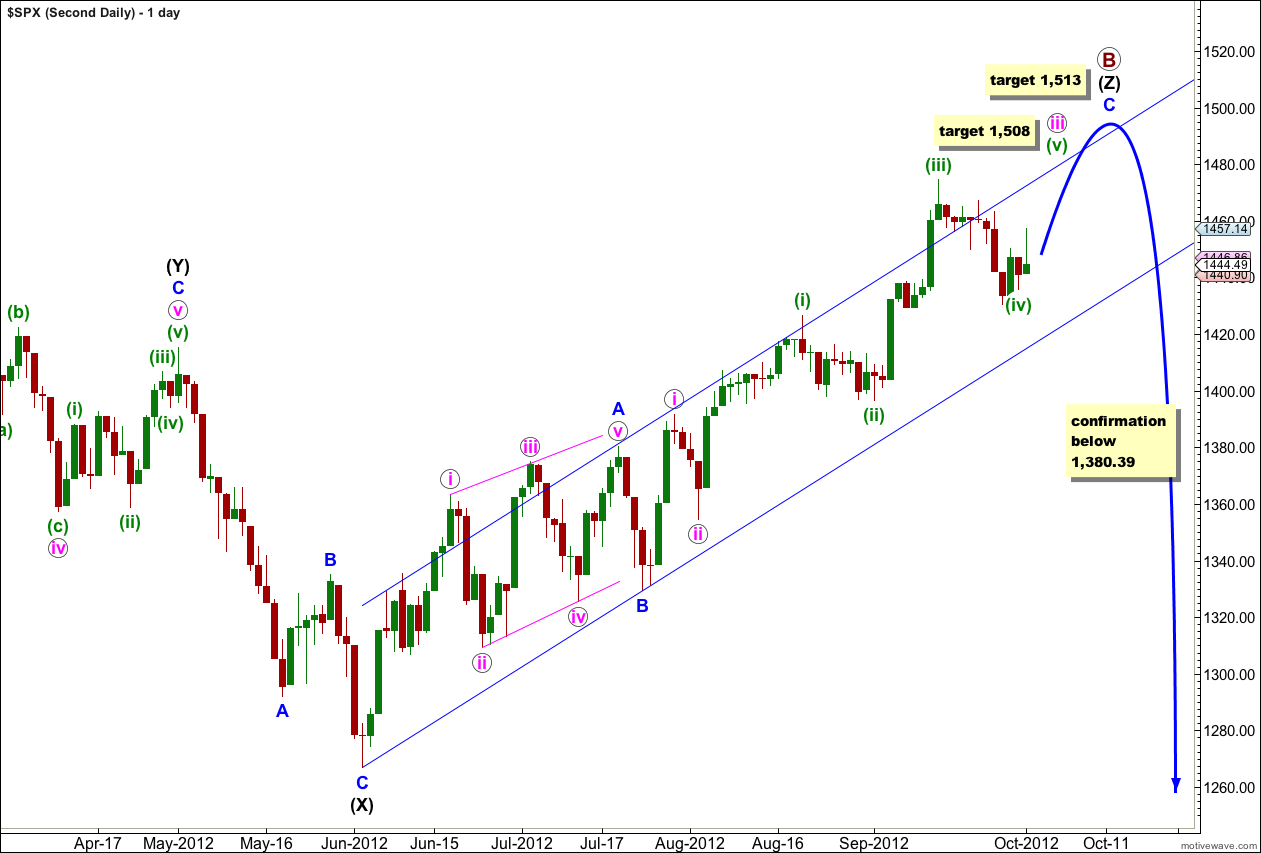
At grand super cycle degree this wave count sees a double flat correction unfolding, which is a common structure. The second flat in the double has begun. Within a flat the A wave must subdivide into a three wave structure, so here at cycle degree a three wave flat is unfolding. Within cycle wave a primary wave A is complete and primary wave B may be incomplete.
At 1,508 wave (v) green would reach equality in length with wave (i) green.
Thereafter, a fourth wave correction for wave iv pink should last about a week or so.
Further upwards movement for wave v pink would complete this wave count at all degrees. At 1,513 wave C blue would reach 1.618 the length of wave A blue.
Thereafter, movement below 1,380.39 would take price back into what is wave 1 blue price territory for the first monthly wave count, and that would tip the balance in favour of this second wave count.
At the hourly chart level at this stage both this second wave count and the first wave count are the same. The hourly chart above will suffice for this wave count also.
Second Daily Wave Count – Alternate.
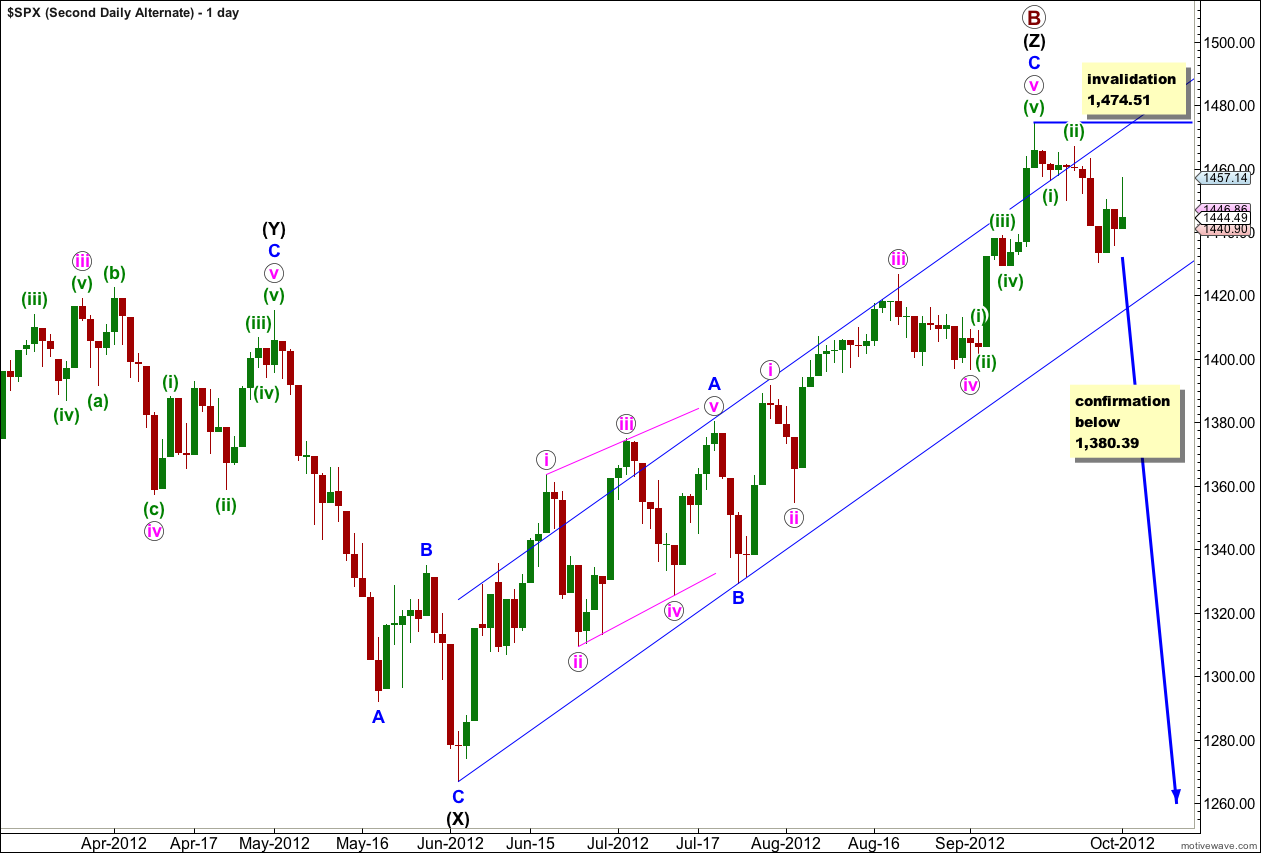
It remains possible, but unlikely, that primary wave B is over and we have recently seen a large trend change.
We should always assume that the trend remains the same, until proven otherwise. At this stage we have absolutely no confirmation of a trend change. We will not have confirmation until price moves below 1,380.39 invalidating the main wave count.
I publish this chart so that we aware of this possibility. We should not rely upon it without confirmation.
Within the new downwards trend no second wave correction may move beyond the start of the first wave. This wave count is invalidated with any movement above 1,474.51.
Not only does this wave count not work for the Dow but it now does not work on the hourly chart level either. I cannot, at this stage, see an explanation for movement above 1,456.13 yesterday if we have a new downwards trend.
Lara, why go with the expaning triangle count when you know them to be very rare. There are numberous other more probable counts that can be labled?
Because all the subdivisions so far fit so perfectly. It would be within wave d of the triangle, close to the end.
Also, the second daily wave count expects pretty much the same movement and also has a low probability due to the length of primary B in relation to primary A.
So at this stage I expect these two wave counts both are low probability, and about even.
There is a third possibility. That we are in the very early stages of a new bull market to last decades. This is my third monthly wave count.
At this stage, after staring at those monthly charts for a LONG time, I cannot see a high probability explanation for this movement.
Sometimes the low probability wave count is the one which is correct. Unfortunately with the nature of probability it is never the one you favour.
I have three wave counts at the monthly chart level. If you have another wave count at this level I would be interested to see it. Please email me a link or a copy. I am open to considering all possibilities.