
Over the last few days I have given some considerable thought to the monthly wave counts in the historical analysis section. I don’t want to swap the alternate over with the main because it still has a low probability due to the rarity of the structure within it. However, I will now run both monthly wave counts alongside each other. They have about an even probability now that price is above 1,464.
No matter which monthly wave count we use the structure at the hourly chart is at this stage the same. The target is the same in the short term.
Click on the charts below to enlarge.
First Wave Count.
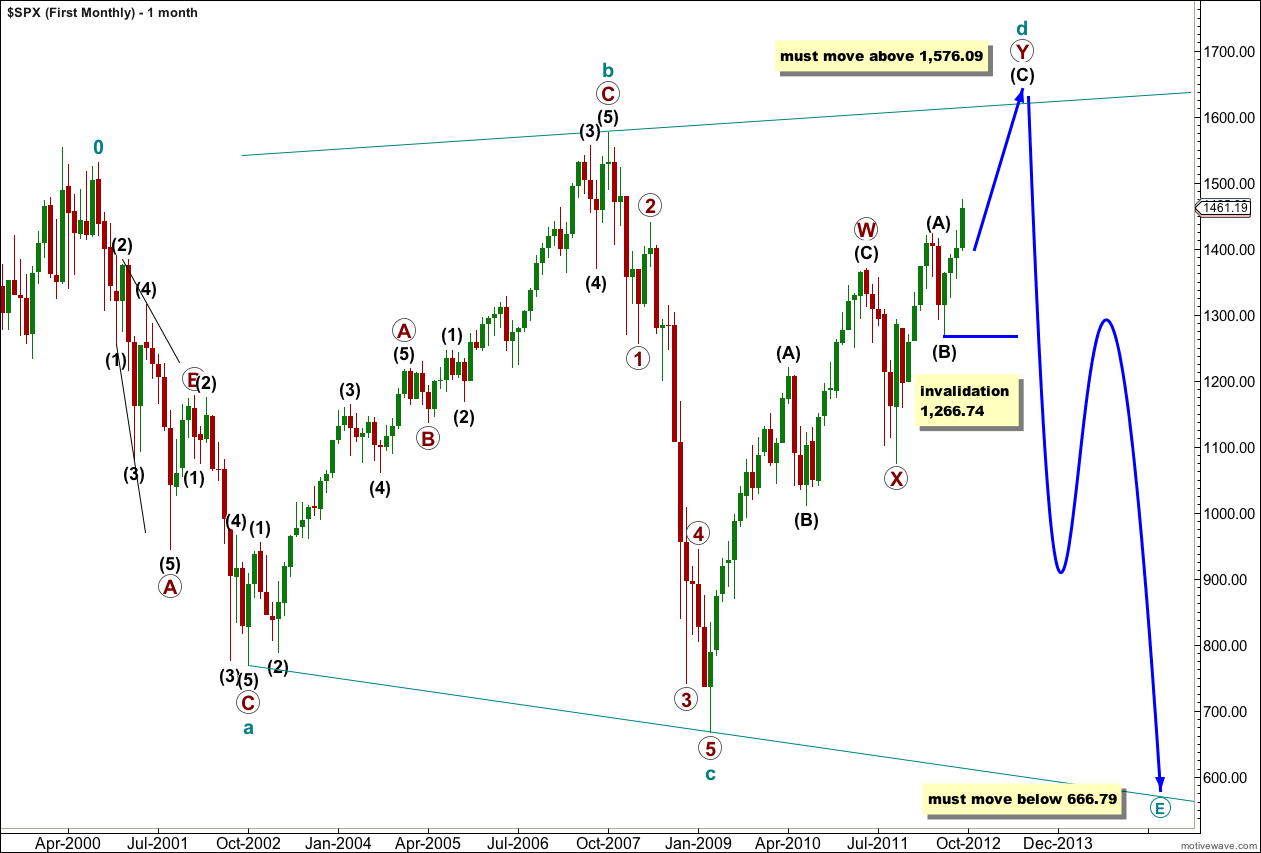
This wave count was an alternate monthly wave count that I have had for some time and have been referring to recently.
At super cycle degree this wave count sees an expanding triangle unfolding. Within the triangle cycle wave d is unfolding as a longer lasting and more complicated double zigzag structure.
Within this double zigzag the second zigzag labeled primary wave Y is incomplete.
Within primary wave Y wave (C) black is incomplete.
The triangle is expanding because cycle wave c ended below the low of cycle wave a. Within an expanding triangle wave d must move beyond the end of wave b, so cycle wave d must make a new all time high above 1,576.09.
When cycle wave d is complete (probably in a few more months) then cycle wave e should crash to new lows. Cycle wave e must move price below the end of cycle wave c at 666.79.
To the downside within wave (C) black no second wave correction may move beyond the start of its first wave. This wave count is invalidated with movement below 1,266.74 in the mid term.
Wave (C) black must unfold as a five wave structure.
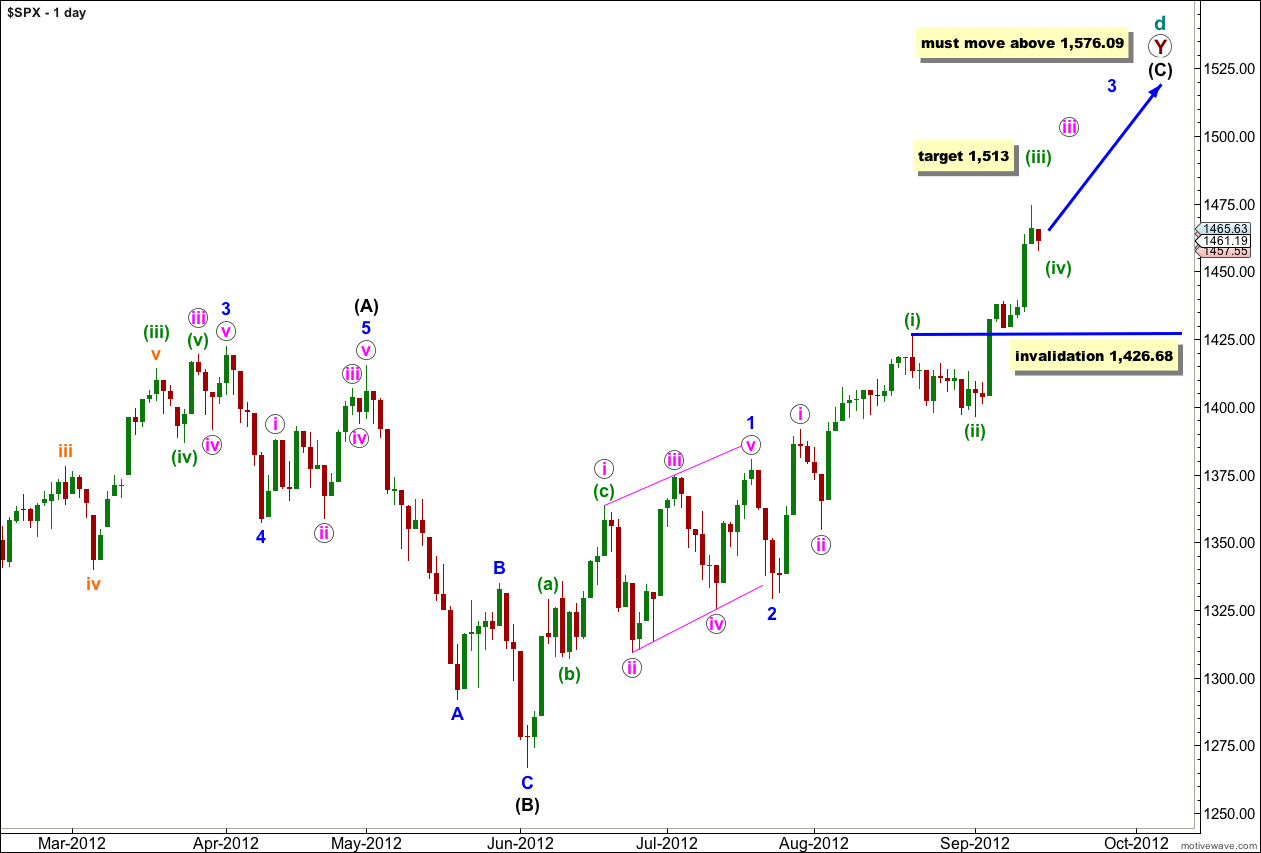
Waves 1 and 2 blue are complete. At this stage wave 3 blue is unfolding upwards as an impulse.
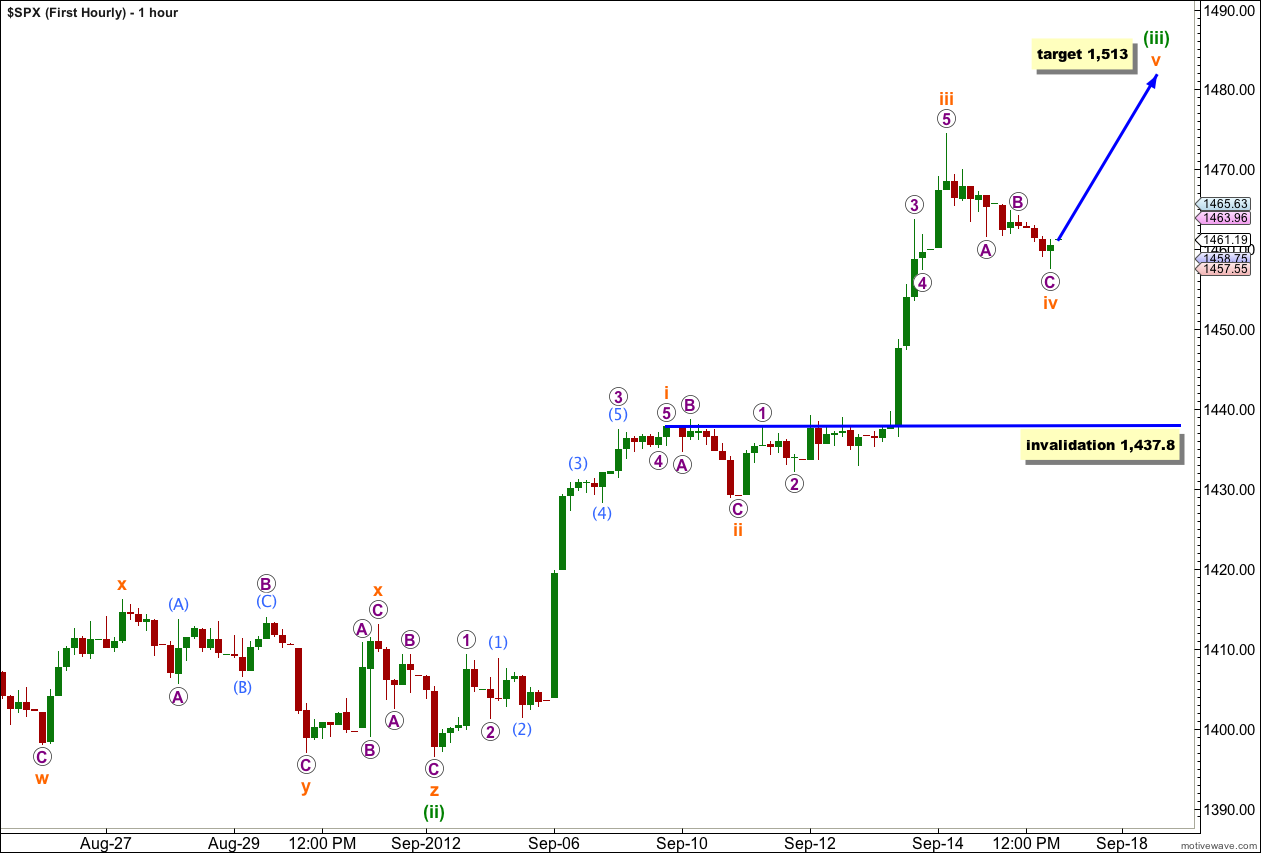
Within wave 3 blue at 1,513 wave (iii) green would reach 1.618 the length of wave (i) green.
When wave (iii) green is complete wave (iv) green may not move into wave (i) green price territory. This wave count is invalidated with movement below 1,426.68.
Within wave (iii) green the structure is incomplete.
Wave iii orange was 4.19 points longer than equality with wave i orange.
Wave iv orange extended a little lower during Monday’s session.
I have adjusted the subdivisions within this upwards movement for wave (iii) green because this agrees with MACD. The strongest reading on MACD is the upwards wave labeled iii orange.
I would expect price to move higher tomorrow.
We should see three fourth wave corrections coming up: first for wave (iv) green, then wave iv pink then for wave 4 blue. After that price for this wave count must make a new high.
Second Wave Count.
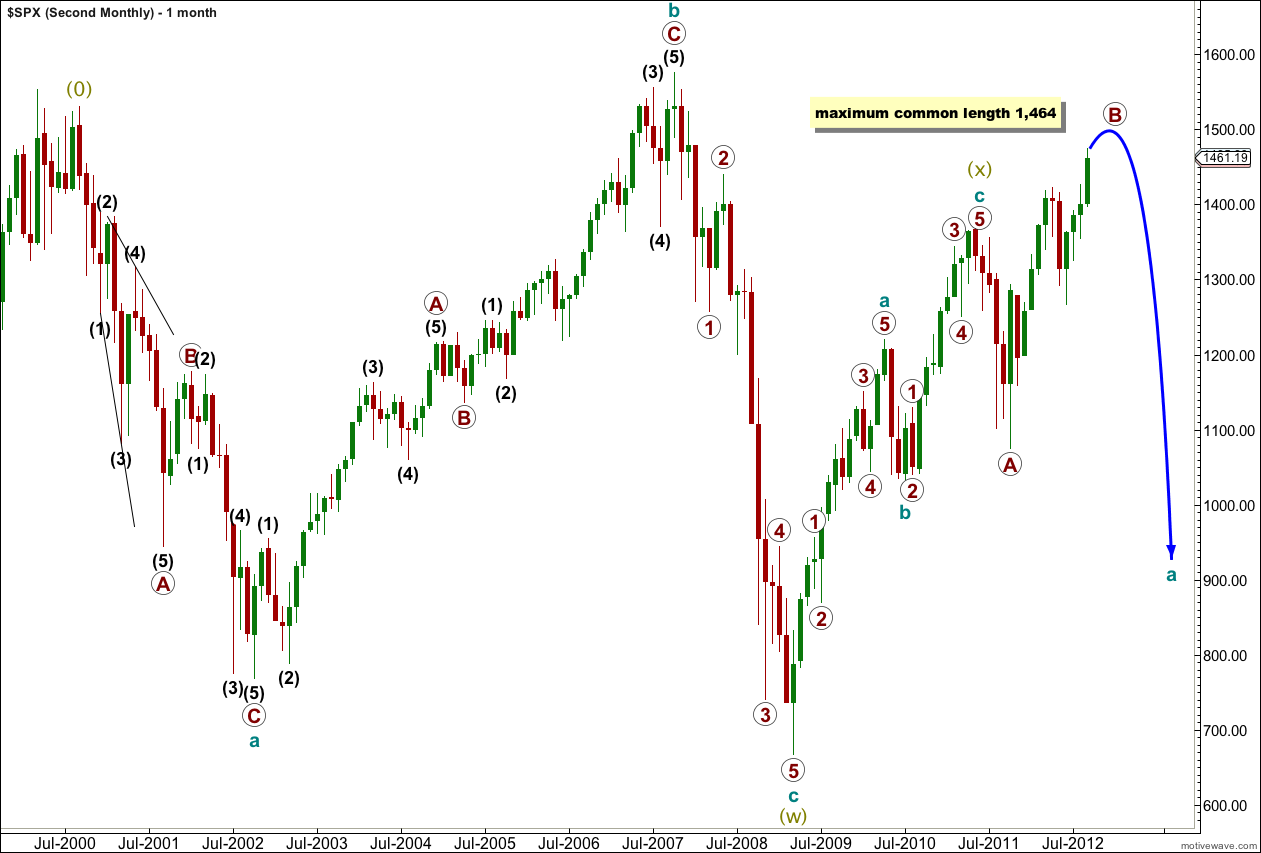
This is the wave count that I have had as a main wave count for a long time now.
At grand supercycle degree a double flat is unfolding. This is a fairly common structure.
Within the double flat the first structure labeled wave (w) olive green is complete. The three in the opposite direction is a zigzag labeled wave (x) olive green. The second flat in the double labeled wave (y) olive green is underway.
Within super cycle wave (y) olive green cycle wave a is unfolding as a three wave structure, itself a flat correction.
Within cycle wave a primary wave A down was a three and now primary wave B upwards is also a three. Primary wave B has just recently passed the maximum common length of a B wave in relation to an A wave for a flat at 1,464. This reduces the probability of this wave count, but does not invalidate it. There is no maximum allowable length of B in relation to A for a flat correction.
Within primary wave B the structure is unfolding as a triple zigzag. The rarity of this structure reduces the probability of this wave count.
The rarity of a triple zigzag along with price movement above 1,464 reduces the probability of this wave count to about even with the first monthly wave count.
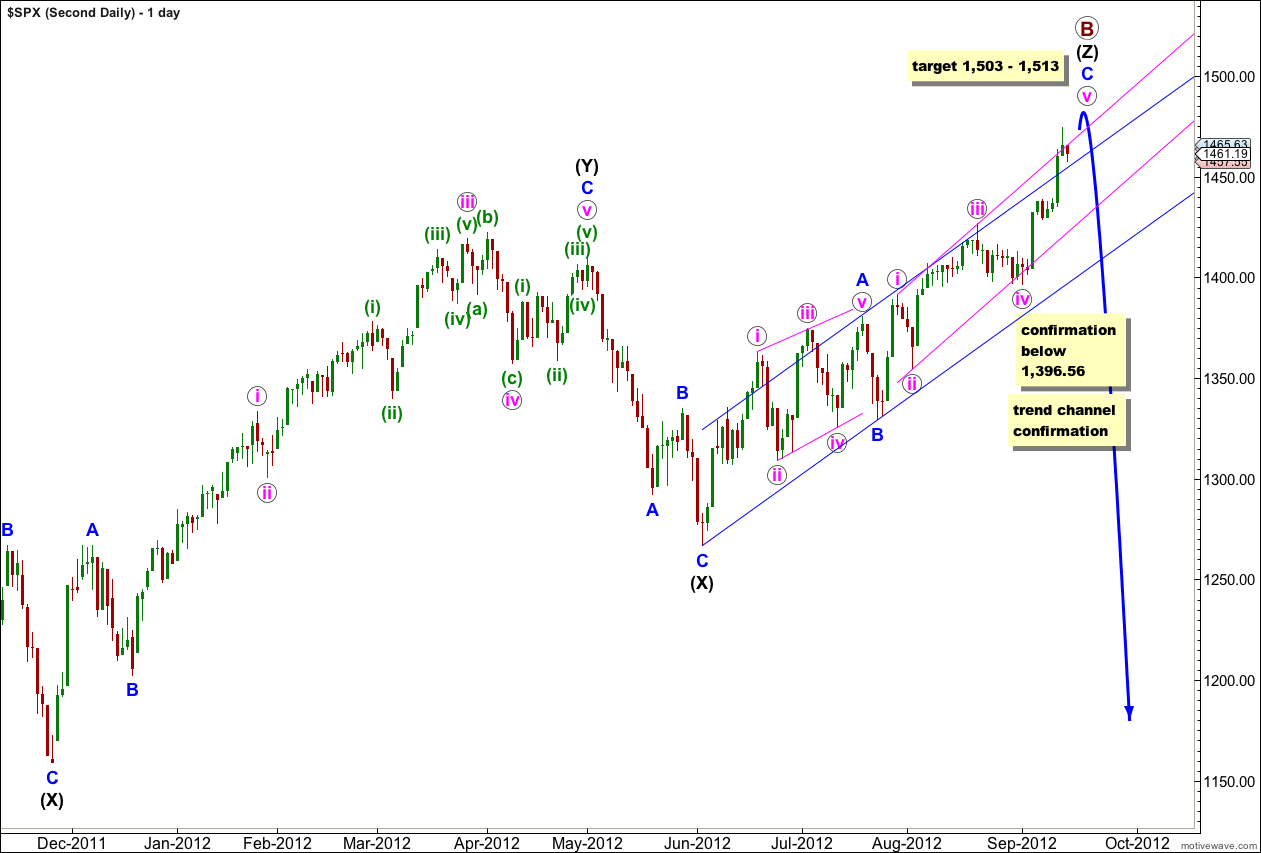
Within the third zigzag of the triple labeled wave (Z) black wave C blue is incomplete.
At 1,513 wave v pink would reach 1.618 the length of wave iii pink. Also at 1,513 wave C blue would reach 1.618 the length of wave A blue.
After price reaches 1,513 the following downwards movement shall provide information about which of these two wave counts is more likely. Movement below 1,380.39 would take price back into what is wave 1 blue price territory for the first monthly wave count, and that would tip the balance in favour of this second wave count. If price does not move below this point we must allow for the reasonable possibility that we shall see new all time highs within a few months.
This could help you, for the pass 4 months we have been trading the large Inverse Head and Shoulders Pattern (or Cup and Handle Pattern) with a Head at 1075, Shoulders at 1250, with upward sloping Neck-Line right near 1440.
Minimum target of 1717 on the SP-500 sometime in mid-to-late 2013.