
Last analysis expected more upwards movement. The target at 1,469 has been exceeded by 5.51 points.
Again, a careful analysis of structure is required to indicate whether or not this upwards trend is over.
Today, I have one daily and one hourly charts for you.
Click on the charts below to enlarge.
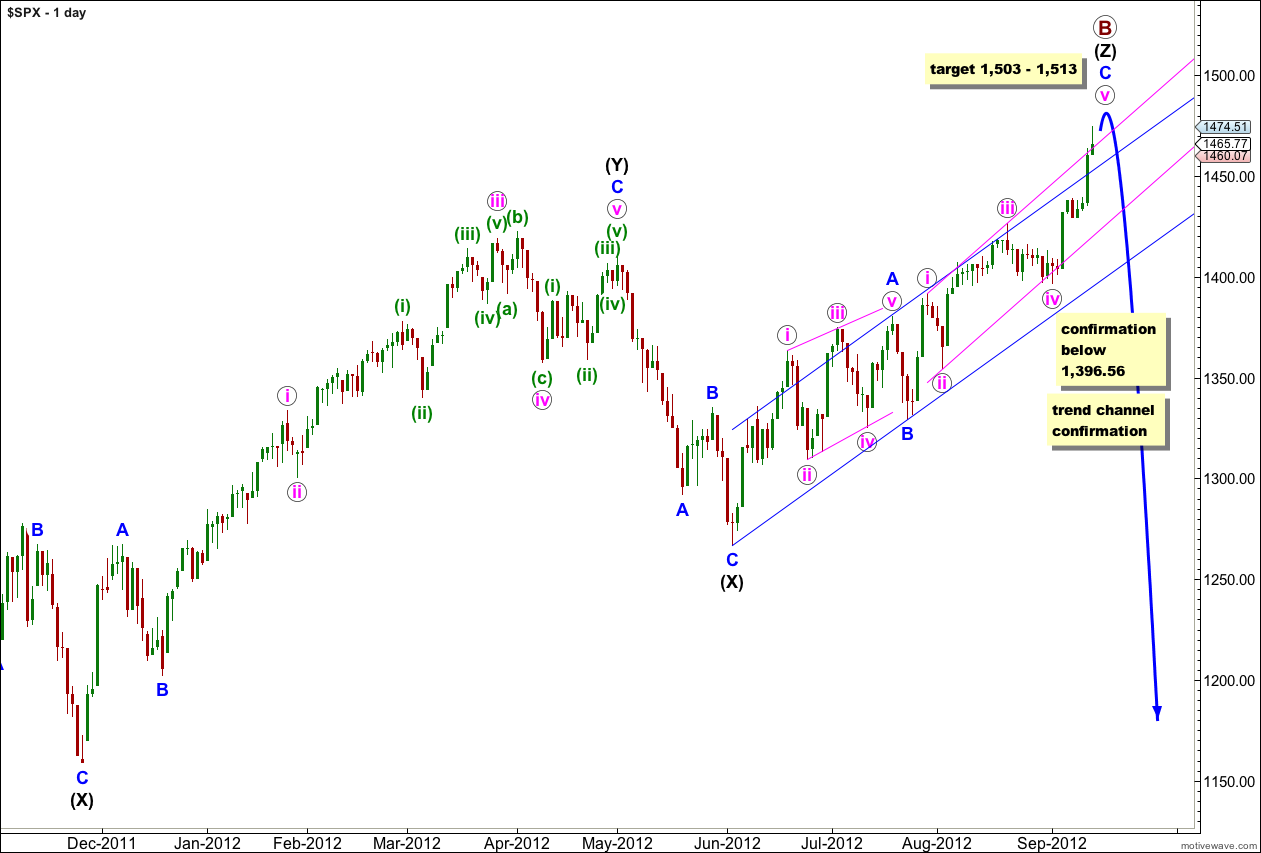
Upwards movement is unlikely to be over at this stage. The structure within the final upwards wave is incomplete.
At 1,513 wave v pink would reach 1.618 the length of wave iii pink. Also at 1,513 wave C blue would reach 1.618 the length of wave A blue.
At primary degree the structure unfolding is an expanded flat correction. Within this structure the maximum common length of primary wave B would be about 1,464 which is 138% the length of primary wave A. Price is right at this point today.
Within wave (Z) black wave A blue was a leading contracting diagonal. Wave B blue was a brief zigzag. Wave C blue is exhibiting alternation with wave A blue and unfolding as an impulse.
Within wave C blue wave i pink lasted 4 sessions and wave iii pink lasted 13 sessions. I would expect wave v pink to last between 4 and 13 sessions. If wave v pink is to have a Fibonacci duration it may end after 1 more session, lasting a Fibonacci 8 sessions. The next Fibonacci number in the sequence would be 13, this would be met in another 6 sessions.
When the parallel channel about wave (Z) black is clearly breached by downwards movement then we shall have confirmation of a trend change.
Keep drawing the parallel channel about wave C blue. Draw the first trend line from the highs of i to iii pink, place a parallel copy upon the low of wave ii pink. Wave v pink may find resistance here at the upper edge of the channel, and it looks like we are seeing a small overshoot.
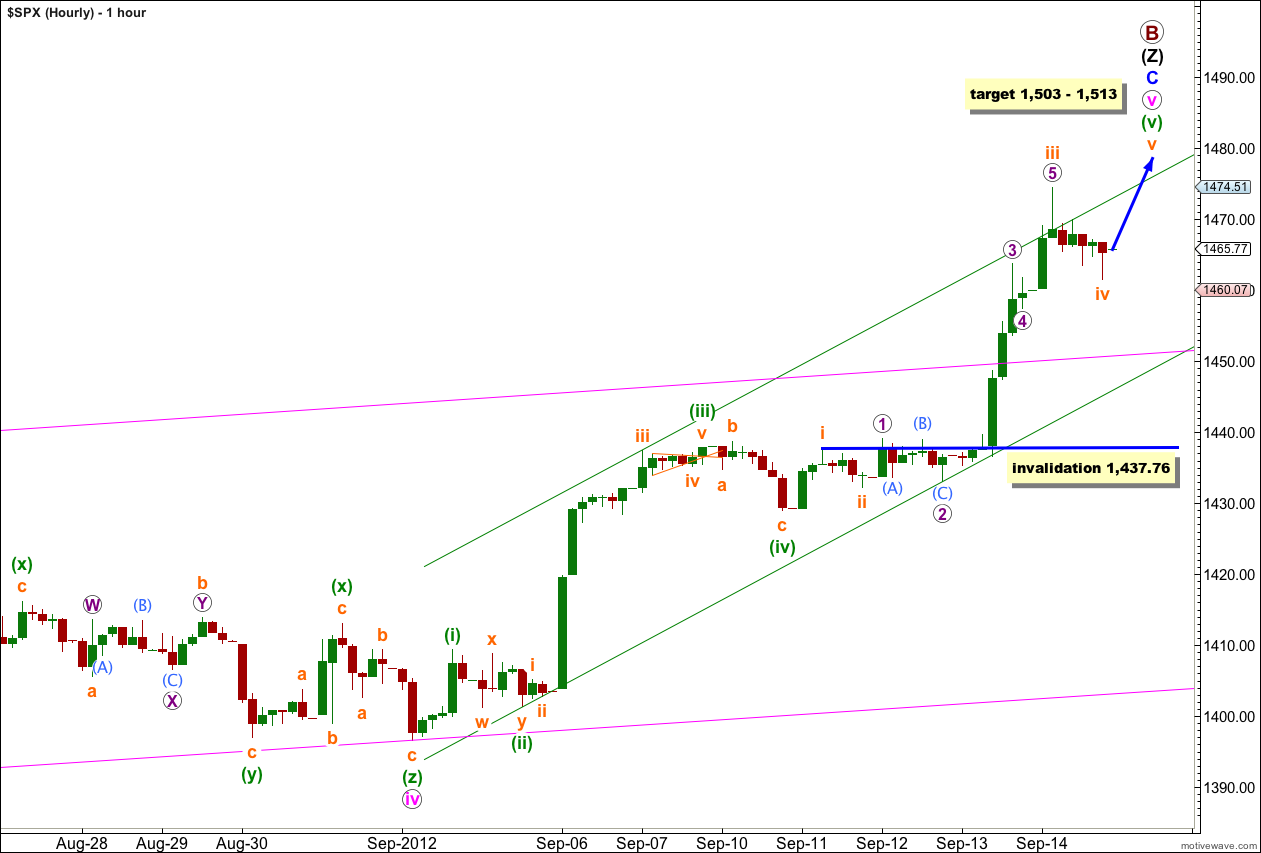
Within wave (v) green wave v orange is yet to unfold.
Ratios within wave iii orange are: wave 3 purple is 1.41 points longer than 4.236 the length of wave 1 purple, and wave 5 purple is 1.07 points longer than 2.618 the length of wave 1 purple and 1.95 points short of 0.618 the length of wave 3 purple.
Wave (iii) green is 3.04 points longer than 2.618 the length of wave (i) green. With a Fibonacci ratio already exhibited within wave v pink I am not expecting to see one between wave (v) green and either of waves (i) or (iii) green.
Within wave (v) green there is no Fibonacci ratio between waves iii and i orange. If wave iv orange has ended and price does not move it lower then at 1,503 wave v orange would reach equality in length with wave iii orange.
When markets open on Monday then any further downwards extension of wave iv orange may not move into wave i orange price territory. This wave count is invalidated with movement below 1,437.76.
The green parallel channel drawn here is a best fit. We may see wave v orange end about the upper edge of it. When this channel is clearly breached with downwards movement we shall have an early indication of a trend change.
wave iii orange looks like my Major [3] top 1474.51 … looking for [4] 1419.15 then [5] = 1.62* [1] => 1603
You said the Maximum length of wave b is 1464, but your latest target is 1503, how to explain it? Thanks.
Yes I did. It is the maximum common length, it is not a point beyond which the count is invalidated.
However, I am looking at the monthly charts and thinking it’s time now to swap over to the alternate. The expanding triangle scenario is looking pretty good.
I’ll be updating this tomorrow.