
Last analysis expected sideways and lower movement to end a little below 1,428.33 before price turned higher. However, the S&P 500 simply continued to move higher during Friday’s session, with 5 hours of sideways movement which looks like a perfect triangle.
Price is now close to the target zone, and the probability of reaching it has increased.
Click on the charts below to enlarge.
Upwards movement may end during Monday’s session, if my target calculation is correct. At this stage I am expecting a big trend change early next week after a little more upwards movement towards the target zone.
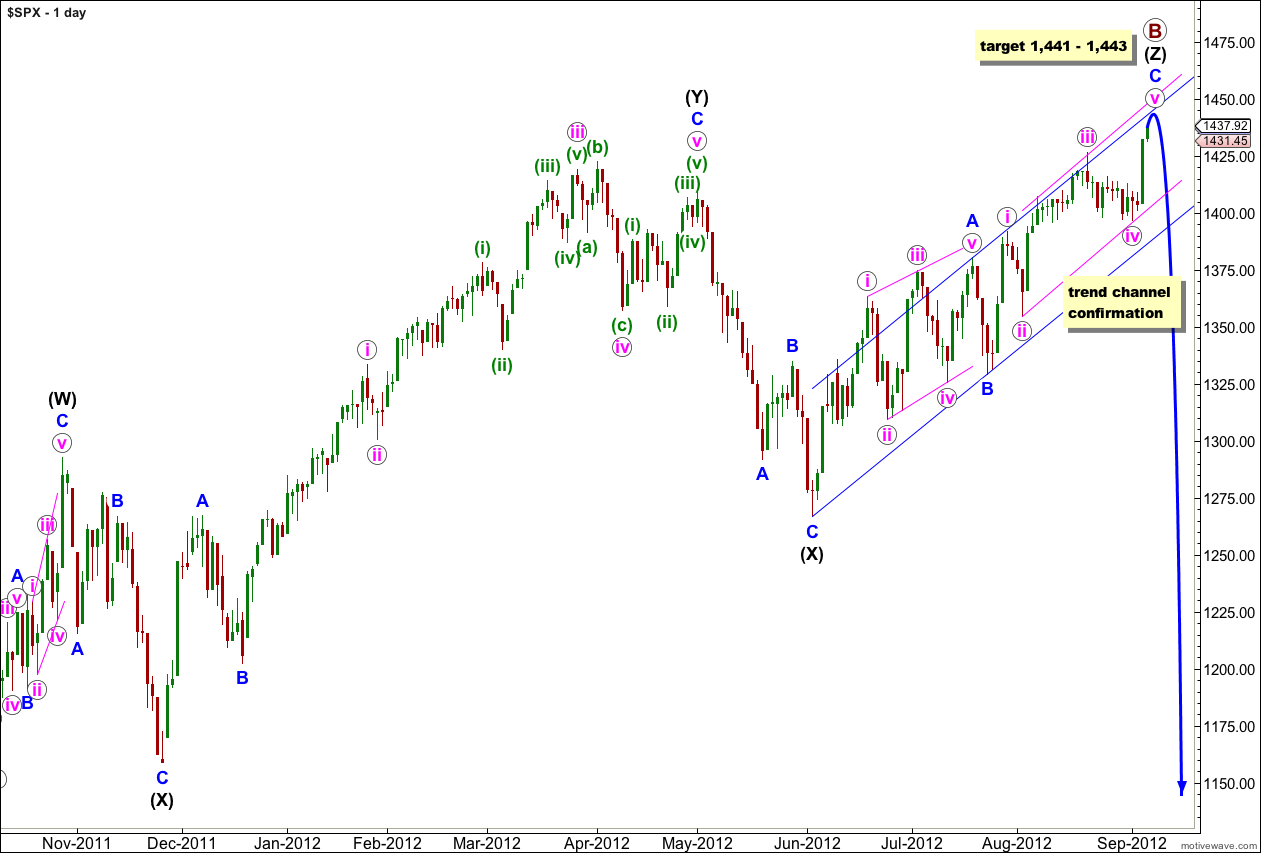
This upwards movement (from the low labeled primary wave A) has a lot of overlapping three wave structures within it. Because the upwards wave labeled intermediate (black) (W) can only be seen as a three wave structure, the only structure that fits for this entire movement within this wave count is a triple zigzag.
The only other Elliott wave structure which has these subdivisions is a leading (or ending) diagonal. This would fit within the second alternate monthly wave count which may be found here. It could also possibly fit as an ending diagonal for the first monthly alternate, the expanding triangle scenario.
Within wave (Z) black wave A blue was a leading contracting diagonal. Wave B blue was a brief zigzag. Wave C blue is exhibiting alternation with wave A blue and unfolding as an impulse.
When the parallel channel about wave (Z) black is clearly breached by downwards movement then we shall have confirmation of a trend change.
Within wave C blue wave iv pink may not move into wave i pink price territory. This wave count is invalidated with movement below 1,391.74.
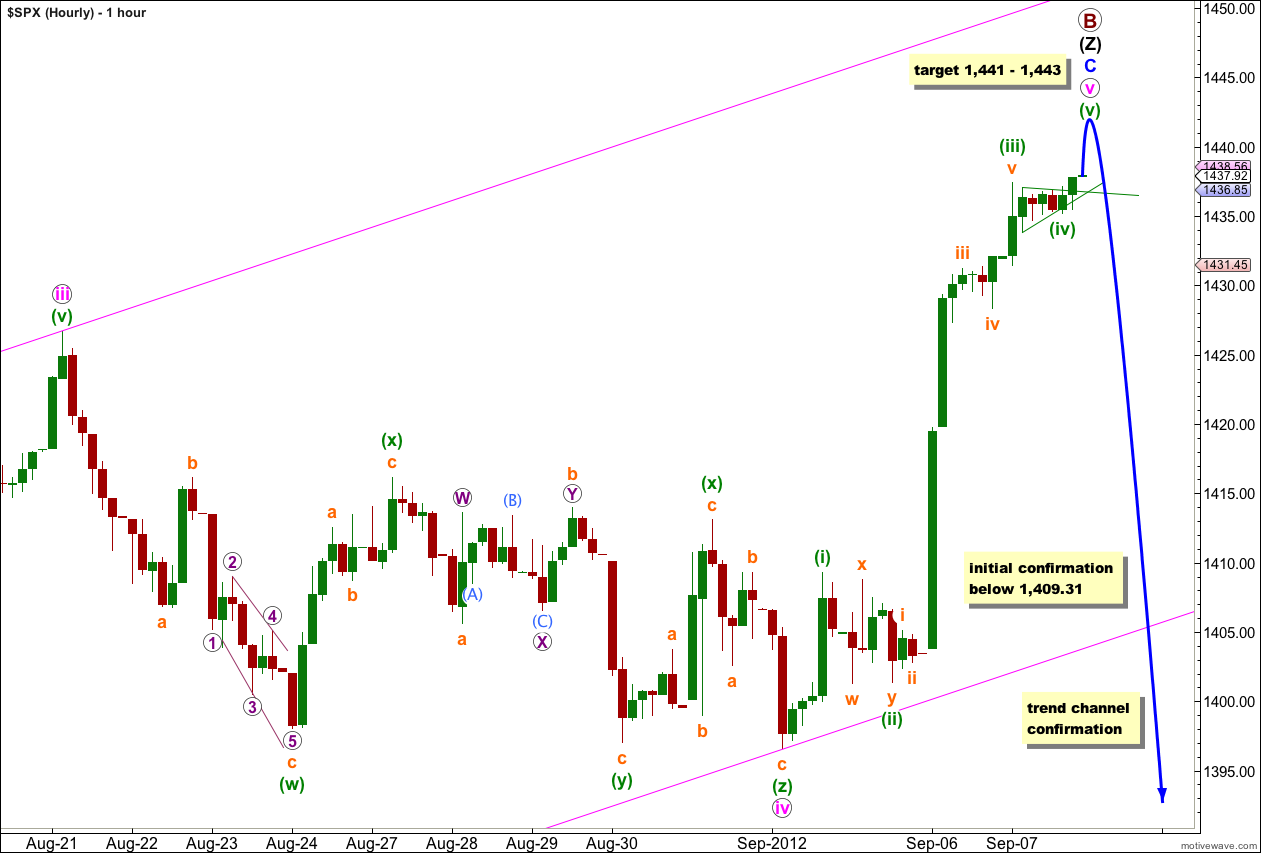
Wave (iii) green continued to move higher to begin Friday’s session and that was not where wave (iv) green began.
Wave (iv) green took up most of Friday’s session and on the 5 minute chart it can be seen as a perfect contracting triangle. The point in time at which the triangle trend lines cross over may be when we see a big trend change with the end of primary wave B. If this tendency plays out on Monday then we shall see the trend change on Monday.
Wave (iii) green is now 2.63 points longer than 2.618 the length of wave (i) green, and there is still a reasonable Fibonacci ratio between them.
Ratios within wave (iii) green are: wave iii orange is 2.75 points longer than 6.854 the length of wave i orange, and wave v orange is 0.76 points longer than 2.618 the length of wave i orange.
At 1,443 wave C blue would reach equality in length with wave A blue.
At 1,441 wave v pink would reach 0.618 the length of wave iii pink.
At 1,443 wave (v) green would reach 0.618 the length of wave (i) green.
This three point target zone has a good probability.
If price continues to rise beyond the target zone then I would expect upwards movement to find resistance about the upper edge of the pink parallel channel drawn here on the hourly chart.
When price moves below 1,409.31 then wave v pink would have to be over because downwards movement could not be just a fourth wave correction. This will be an early indication that we may have had a trend change.
When price moves below 1,391.74 (into wave i pink price territory) then the entire structure of wave C blue would also have to be over. This would be stronger evidence of a trend change.
When price moves below the parallel channel on the hourly chart we may have some confidence in the trend change. Full confidence will come when price moves below the parallel channel on the daily chart. At that stage I will calculate a target for primary wave C downwards for you. To do so prior to trend channel confirmation would be premature.
ES Trying to change the perfect contracting triangle into a ascending broadening wedge” tonight .. which should give us a target of 1448 E-mini
Value Area Low (VAL) 1434.25 KEY tonight
http://www.cmegroup.com/trading/equity-index/us-index/e-mini-sandp500.html
The ES futures market is different to the S&P500 cash index which I analyse. It will have a different wave count. Futures have more leverage and consequently may see more extreme price movements.
Do you have a plan “B” when we bounce in the 1420 area?
Of course. It’s in the historical analysis section, which is linked to here in the text and is on the sidebar.