
Last analysis expected upwards movement from the S&P 500 for Thursday’s session. The short term target at 1,422 was well exceeded though. I had expected momentum to increase a little, but momentum did increase quite a bit more than a little.
I still have just the one daily and one hourly charts today. So far they are explaining direction quite nicely. The target remains the same.
Click on the charts below to enlarge.
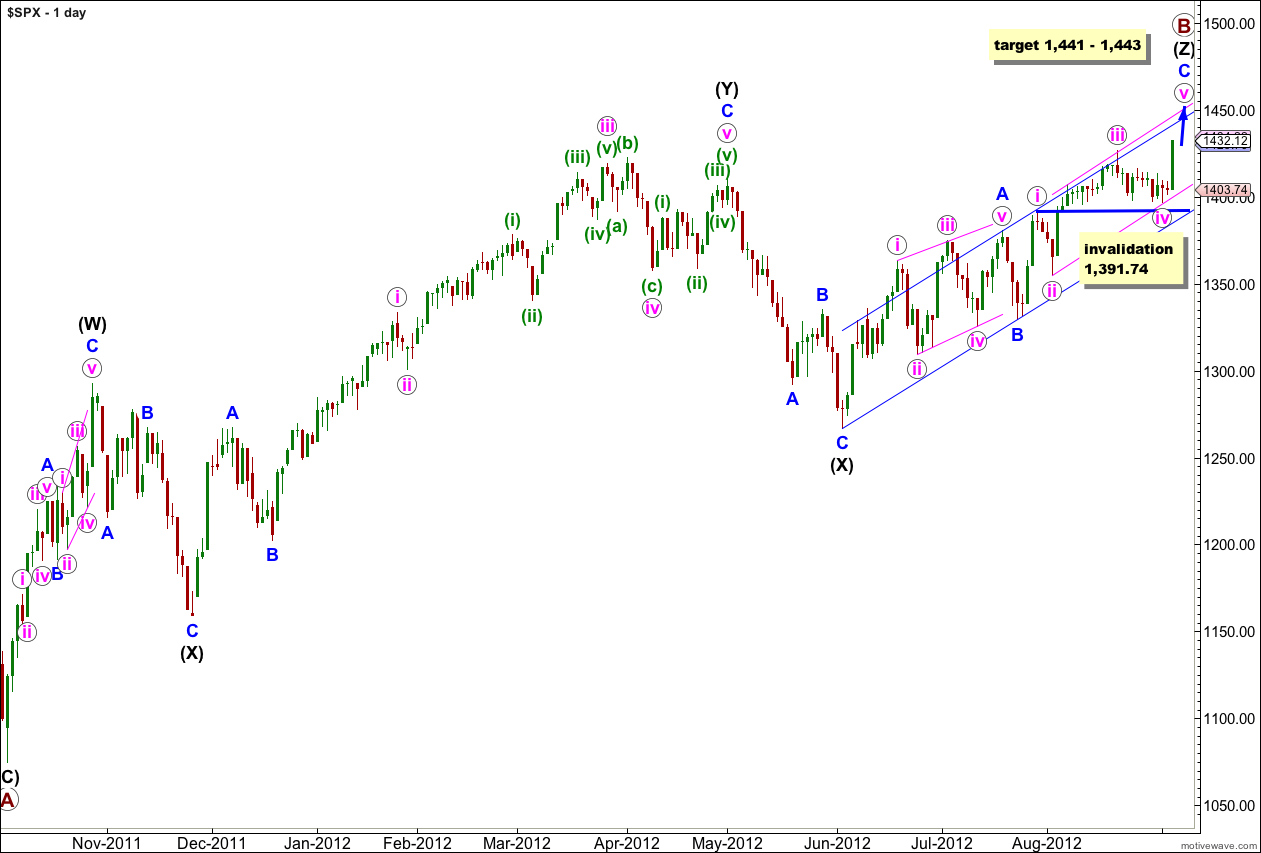
With a new high made during Thursday’s session it is clear that wave C blue is not over and is unfolding as an obvious impulse on the daily and hourly charts.
Wave iv pink is now complete and wave v pink is in its final stages. This upwards movement may end in a few more sessions.
This upwards movement (from the low labeled primary wave A) has a lot of overlapping three wave structures within it. Because the upwards wave labeled intermediate (black) (W) can only be seen as a three wave structure, the only structure that fits for this entire movement within this wave count is a triple zigzag.
The only other Elliott wave structure which has these subdivisions is a leading (or ending) diagonal. This would fit within the second alternate monthly wave count which may be found here. It could also possibly fit as an ending diagonal for the first monthly alternate, the expanding triangle scenario.
Within wave (Z) black wave A blue was a leading contracting diagonal. Wave B blue was a brief zigzag. Wave C blue is exhibiting alternation with wave A blue and unfolding as an impulse.
When the parallel channel about wave (Z) black is clearly breached by downwards movement then we shall have confirmation of a trend change.
Within wave C blue wave iv pink may not move into wave i pink price territory. This wave count is invalidated with movement below 1,391.74.
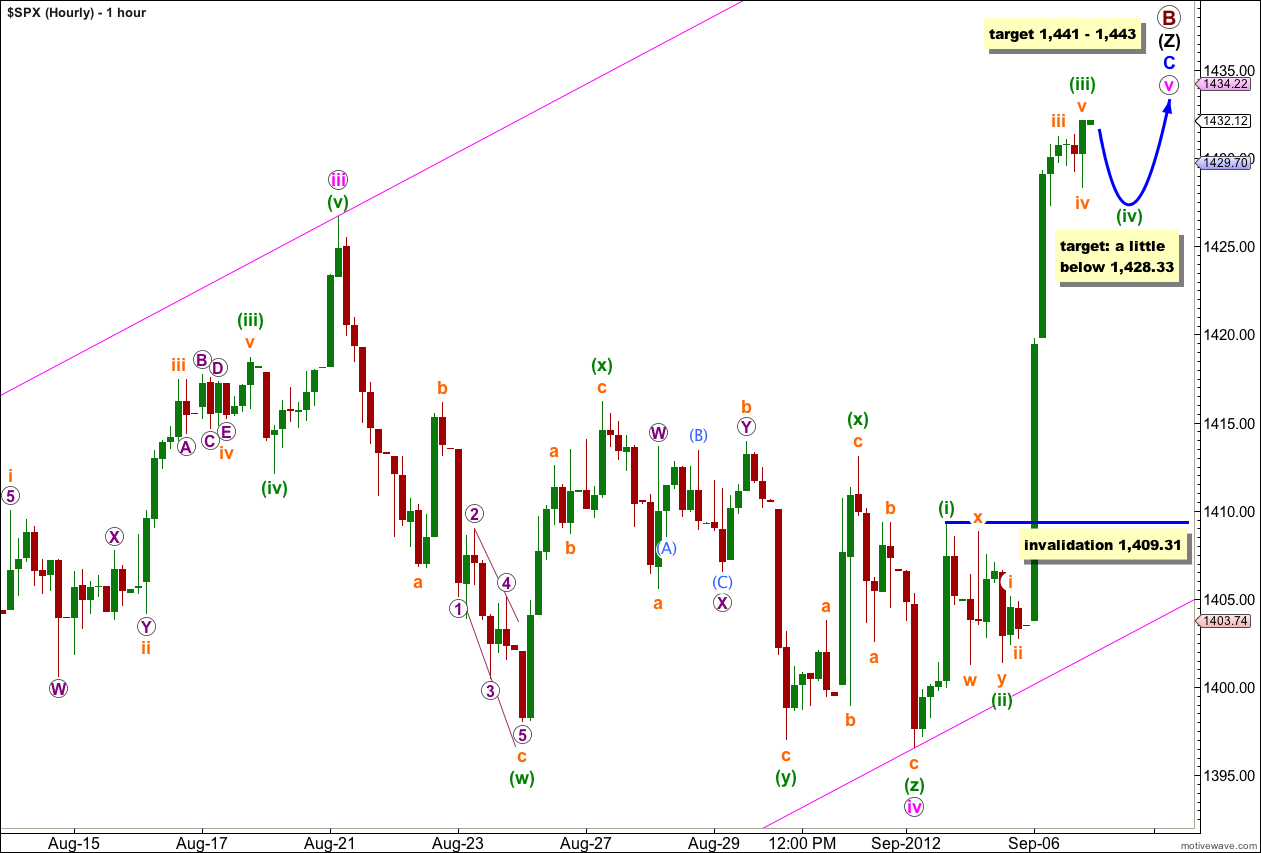
The target for wave (iii) green to reach during Thursday’s session was 1,422. This was very comfortably exceeded. Wave (iii) green is now a complete impulse and is just 2.65 points short of 2.618 the length of wave (i) green.
Ratios within wave (iii) green are: wave iii orange is 2.75 points longer than 6.854 the length of wave i orange, and wave v orange is just 0.03 points longer than equality with wave i orange.
I would expect tomorrow to see some sideways and downwards movement for wave (iv) green. It would be most likely to end a little below the end of the fourth wave of one lesser degree, wave iv orange at 1,428.33.
Wave (iv) green may not move into wave (i) green price territory. This wave count is invalidated at this stage by movement below 1,409.31.
When wave (iv) green is complete I would expect one final upwards wave for wave (v) green towards the target.
At 1,441 wave v pink would reach 0.618 the length of wave iii pink. At 1,443 wave C blue would reach equality in length with wave A blue. This 2 point target zone has a good probability.
Wave v pink should last between 4 and 13 sessions. At this stage it looks like it may be closer to 4 sessions than 13.
Karen,
Do you have a chart of the wave count you are referencing?
After 50% retrace .. I have buy-stops at ES 1416 for the ride up for Wave (3)=> 1495.00
Do not like the looks of this formation … sold everything this morning currently
SHORT ES 1437.00
LONG TVIX 1.83