
Sideways movement from the S&P 500 during Wednesday’s session looks like a low degree correction has completed. Both wave counts remain valid as price is above the invalidation points on the daily and hourly charts.
I now have a short term target for you for the next wave.
Click on the charts below to enlarge.
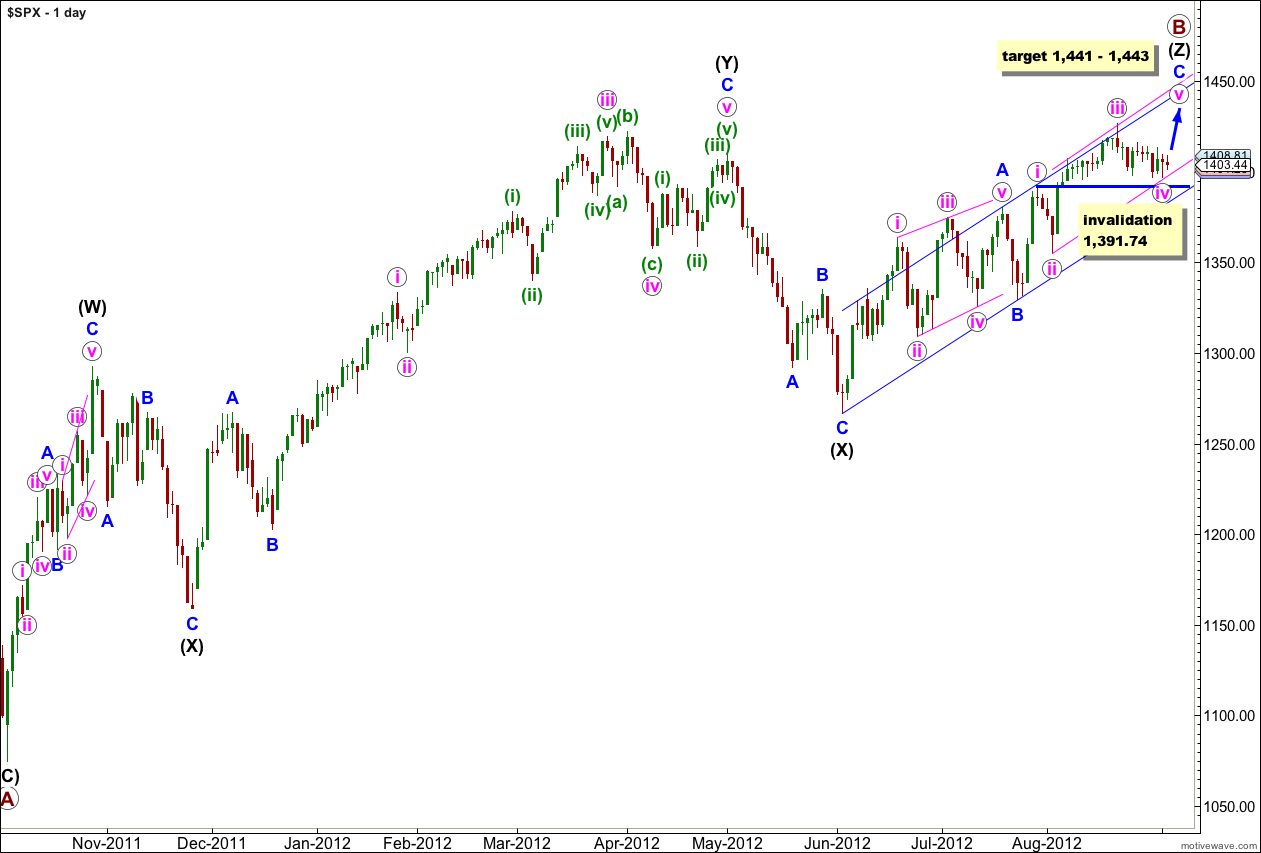
This upwards movement (from the low labeled primary wave A) has a lot of overlapping three wave structures within it. Because the upwards wave labeled intermediate (black) (W) can only be seen as a three wave structure, the only structure that fits for this entire movement within this wave count is a triple zigzag.
The only other Elliott wave structure which has these subdivisions is a leading (or ending) diagonal. This would fit within the second alternate monthly wave count which may be found here. It could also possibly fit as an ending diagonal for the first monthly alternate, the expanding triangle scenario.
Within wave (Z) black wave A blue was a leading contracting diagonal. Wave B blue was a brief zigzag. Wave C blue is exhibiting alternation with wave A blue and unfolding as an impulse.
When the parallel channel about wave (Z) black is clearly breached by downwards movement then we shall have confirmation of a trend change.
Within wave C blue wave iv pink may not move into wave i pink price territory. This wave count is invalidated with movement below 1,391.74.
If price moves below 1,391.74 then the structure within wave C blue must be complete and it would be highly likely that wave Z black would be complete. A triple is the maximum number of corrective structures within a multiple. When the third structure is over the entire correction must be over and there is no way it can continue further.
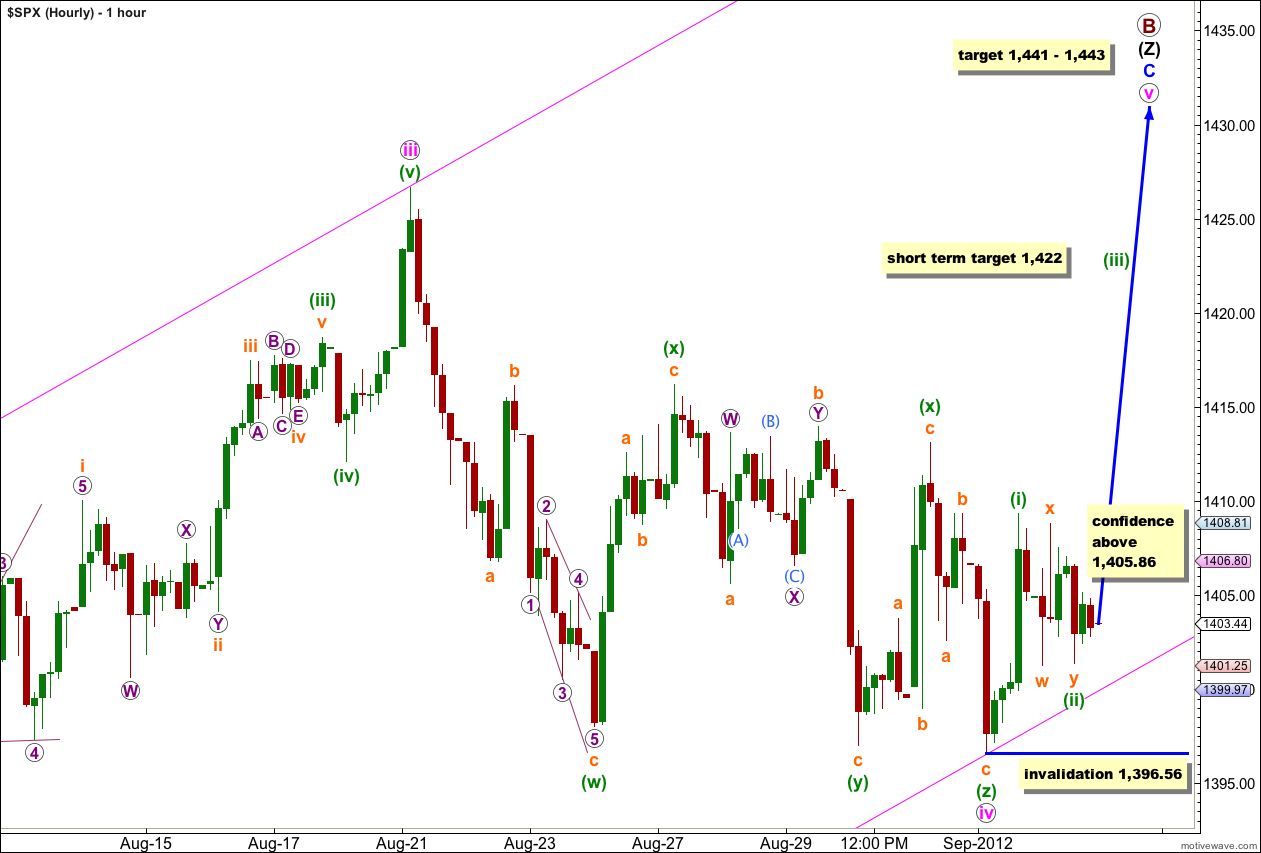
Sideways movement subdivides as a series of threes and wave (ii) green looks most like a double zigzag, which may not be complete. The final C wave downwards within the second zigzag of wave y orange may not be a completed five wave structure when viewed on the 5 minute chart. Movement above 1,405.86 would indicate that it would be complete. At that stage we may have more confidence in the short term target.
If wave (ii) green is over then at 1,422 wave (iii) green would reach 1.618 the length of wave (i) green. Thereafter wave (iv) green should unfold, lasting one to three sessions probably, and not moving price back into wave (i) green price territory.
I have redrawn the parallel channel about this upwards movement for wave C blue. The first trend line is drawn from the lows of ii to iv pink, then a parallel copy is placed upon the high of wave iii pink. We may expect downwards movement to find support at this lower trend line. Wave v pink is most likely to end about mid way within this channel.
Any further movement tomorrow of wave (ii) green downwards may not move beyond the start of wave (i) green. This wave count is invalidated with movement below 1,396.56.
If this wave count is invalidated with downwards movement then I would more seriously consider that we have a high in place and a trend change occurred at 1,426.68. However, we would need to see the parallel channel on the daily chart clearly breached before we may have any confidence in a trend change.
If wave (2) of minor 3 retrace will be 38% from 1441, which is 1424. This will back-test the SPX Cup & Handle Breakout and lead to the move towards 1577.
Just about 10 points over Wave iii target … do not see 1450 holding us down now.
Hi Lara, Just wanted to say that EW structure guide you issued has proven to be extremely handy and useful. Thanks for this (:-)
Hey, that’s great! Thank you for letting me know.