
The S&P 500 moved higher during Monday’s session which is what the main wave count expected. Price is on track to meet the target.
I have only one daily wave count with two hourly wave counts again today. The invalidation points of the hourly wave counts are quite close together, only 6.3 points apart.
Click on the charts below to enlarge.
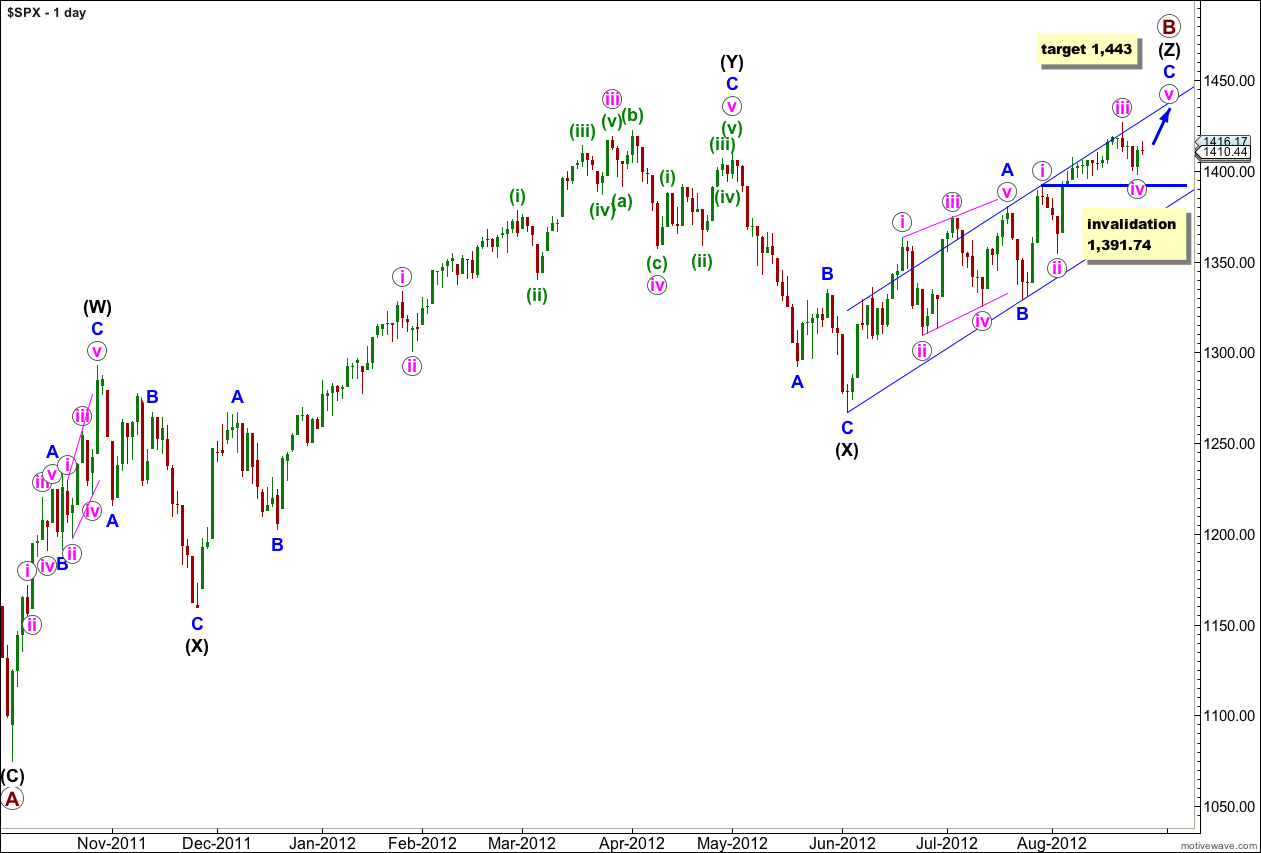
This upwards movement has a lot of overlapping three wave structures within it. Because the upwards wave labeled intermediate (black) (W) can only be seen as a three wave structure, the only structure that fits for this entire movement within this wave count is a triple zigzag.
The only other Elliott wave structure which has these subdivisions is a leading (or ending) diagonal. This would fit within the second alternate monthly wave count which may be found here.
Within wave (Z) black wave A blue was a leading contracting diagonal. Wave B blue was a brief zigzag. Wave C blue is exhibiting alternation with wave A blue and unfolding as an impulse.
When the parallel channel about wave (Z) black is clearly breached by downwards movement then we shall have confirmation of a trend change.
Within wave C blue wave iv pink may not move into wave i pink price territory. This wave count is invalidated with movement below 1,391.74. If this wave count is invalidated with downwards movement then we may consider the alternate hourly wave count below.
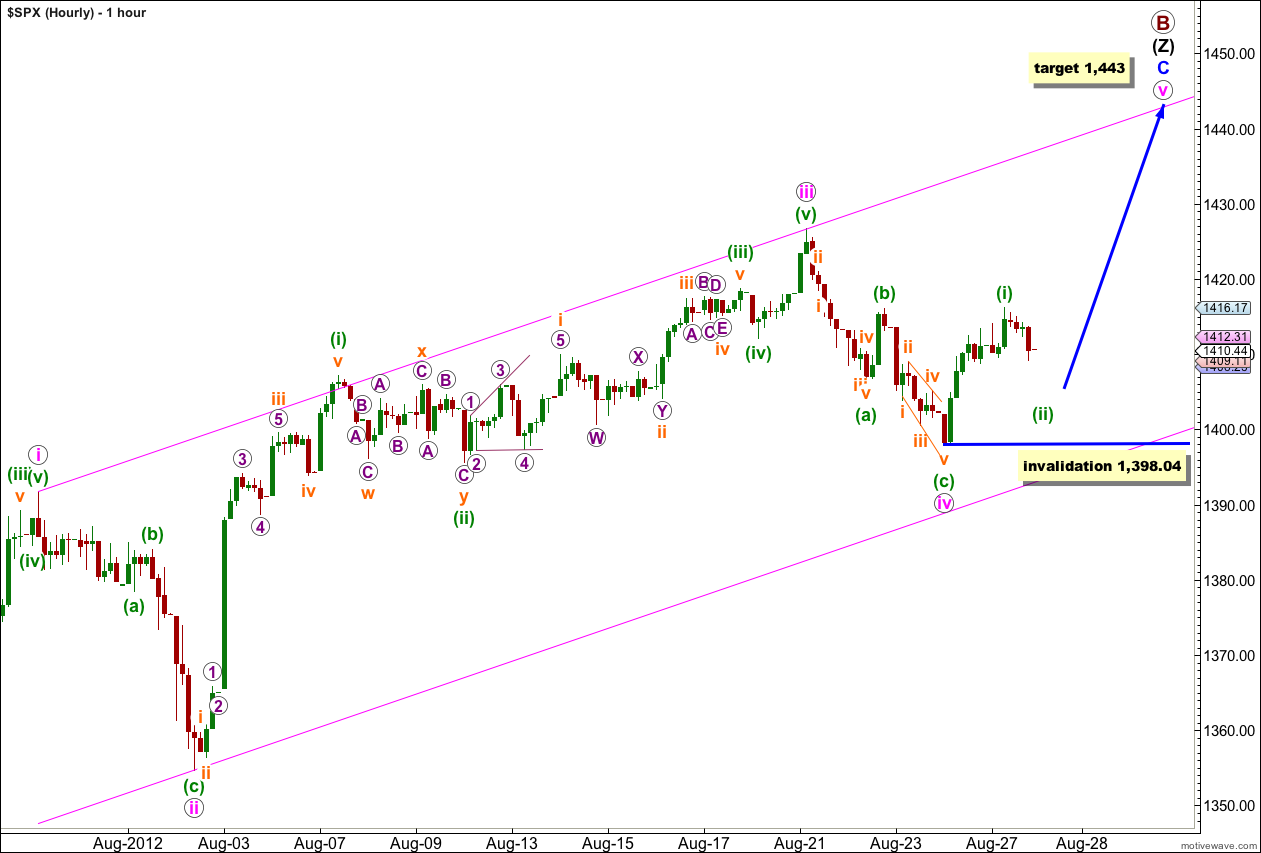
This wave count expects overall upwards movement this week, with two low degree corrections along the way.
Within wave v pink wave (i) green may have extended higher during Monday’s session; there is an ending diagonal for the fifth wave within this movement when viewed on the 5 minute chart.
Wave (ii) green has an incomplete structure on the 5 minute chart. I would expect at least a little downwards movement to begin tomorrow’s session.
Thereafter, we may see a little increase in upwards momentum as a low degree third wave unfolds.
Wave (iii) green must move price above the end of wave (i) green.
At 1,443 wave v pink would reach 0.618 the length of wave iii pink. Also now at 1,443 wave C blue would reach equality in length with wave A blue. This target has a good probability.
Wave v pink should find resistance at the upper edge of the parallel channel drawn here.
Wave (ii) green may not move beyond the start of wave (i) green. This wave count is invalidated with movement below 1,398.04.
If this wave count is invalidated then we should use the alternate hourly wave count below.
Alternate Hourly Wave Count.
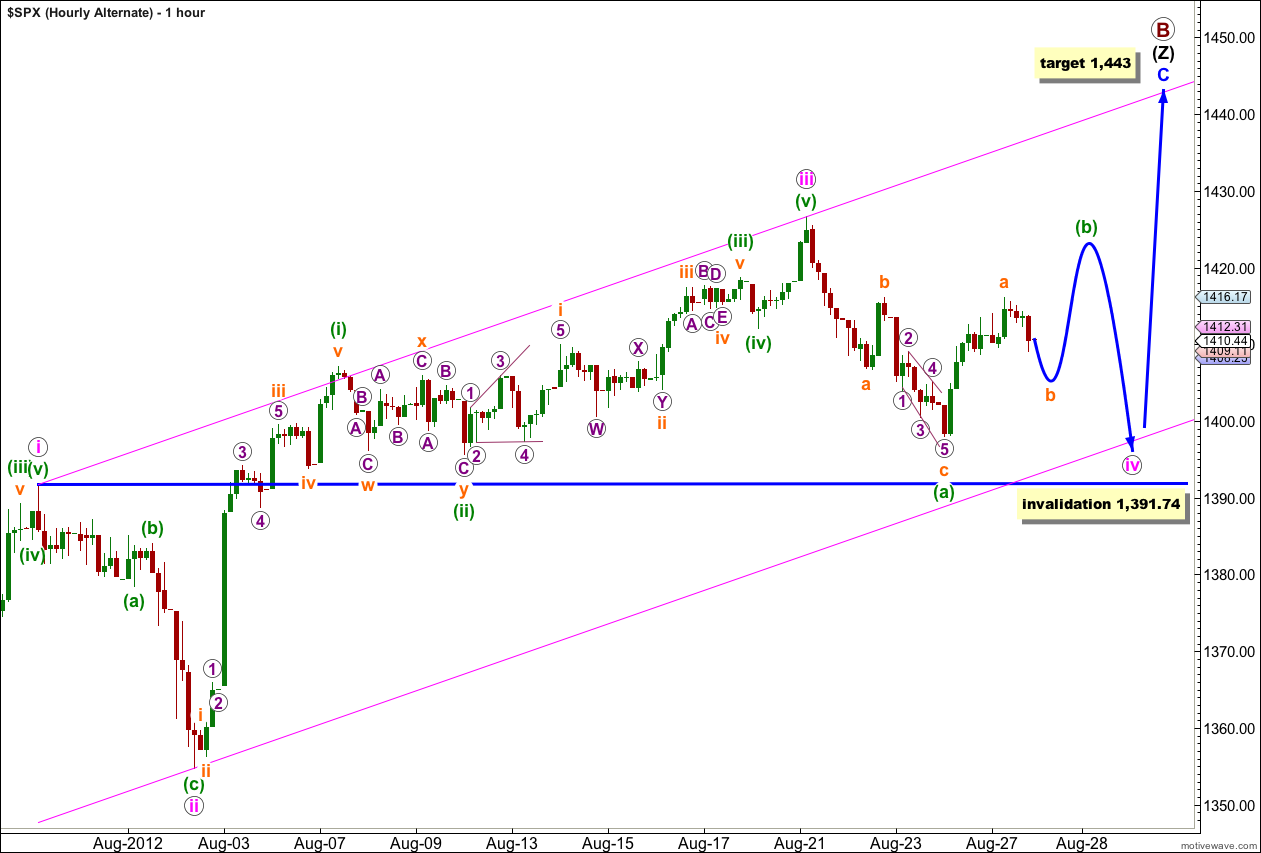
This alternate simply moves the degree of labeling within wave iv pink down one degree. We may be seeing a longer lasting sideways movement for wave iv pink before the final fifth wave upwards.
This alternate wave count expects sideways movement for most or all of this week, followed by another week or so of slow upwards movement for wave v pink.
At 1,424 wave (b) green would reach 90% the length of wave (a) green. About that price point if upwards movement looks like a clear three wave structure then this wave count would have a good probability. Wave iv pink may be a flat correction which requires wave B to be 90% the length of wave A.
Alternately, wave iv pink may be a double zigzag which means upwards movement may unfold as a three wave structure for wave (x) green. X waves within doubles do not have a minimum length.
We will have to look at the upwards structure carefully to determine if this alternate wave count is correct.
Wave iv pink may not move into wave i pink price territory. This wave count is invalidated with movement below 1,391.74.
If this wave count is invalidated with downwards movement this week then I would consider the possibility that we may have seen a trend change at primary degree. I would want to see the parallel channel on the daily chart clearly breached by downwards movement to have any confidence in such a large trend change.
Thank You Lara for your great work!
John A