
Movement above 1,410.03 invalidated the alternate hourly wave count confirming the main wave count. At that stage the short term target was close by at 1,413 and the first target for the movement to end at 1,417 was met during Thursday’s session.
The S&P 500 looks to be completing a corrective structure. At this stage I have now only one daily and one hourly wave count.
If the main wave count is invalidated then I have an alternate historic analysis to refer to. An invalidation of this wave count would be hugely significant and it would change the picture at cycle degree.
Click on the charts below to enlarge.
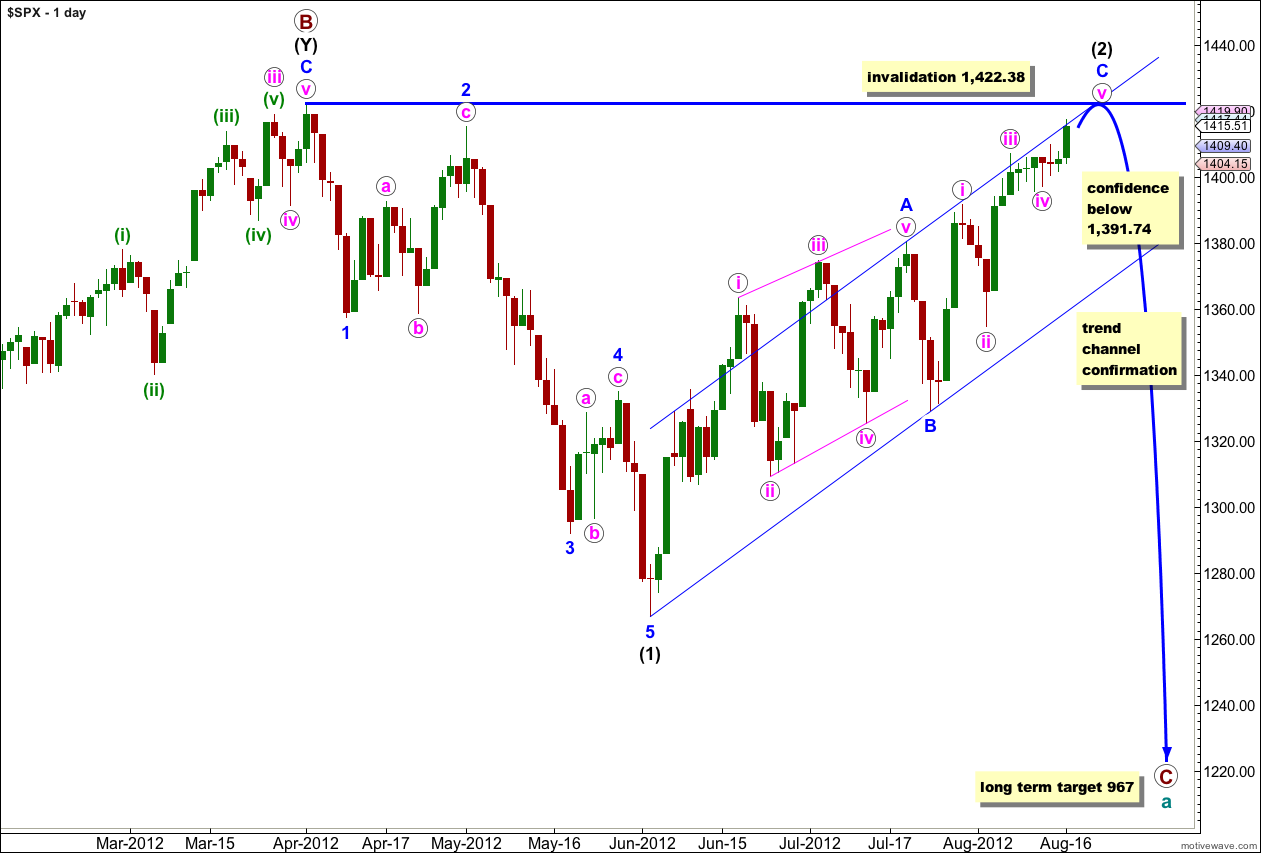
If wave (2) black is a single zigzag then wave A blue was a leading diagonal and it would be likely that wave C blue would be an impulse to see alternation between the two.
There is almost no room left for upwards movement of wave (2) black. Second waves can and often do correct to very deep degrees. When second waves correct to very deep degrees they convince us that we shall see new price extremes, and they do this right before a strong third wave moves price in the opposite direction. We should keep this tendency in mind over the next few days.
On the daily chart it seems clear that wave (1) black downwards has an impulsive structure and wave (2) black upwards has a typically choppy overlapping corrective structure. The overall look of these movements supports this wave count.
Wave (2) black may not move beyond the start of wave (1) black. This wave count is invalidated with movement above 1,422.38.
If price does not move above this point then any subsequent downwards movement below 1,391.74 would be required to provide any confidence in a possible trend change. Movement below the parallel channel on the hourly chart in the first instance, and on the daily chart after that, would provide trend channel confirmation of a trend change.
If this wave count is invalidated with movement above 1,422.38 then the only explanation that I can see at this point is the first alternate monthly wave count in the historic analysis here. This alternate wave count has a completely different expectation: that the S&P 500 is in an upwards trend to make new all time highs. However, the structure within this alternate wave count is an expanding triangle which is one of the rarest of all Elliott wave structures, and the rarity of this structure significantly reduces its probability.
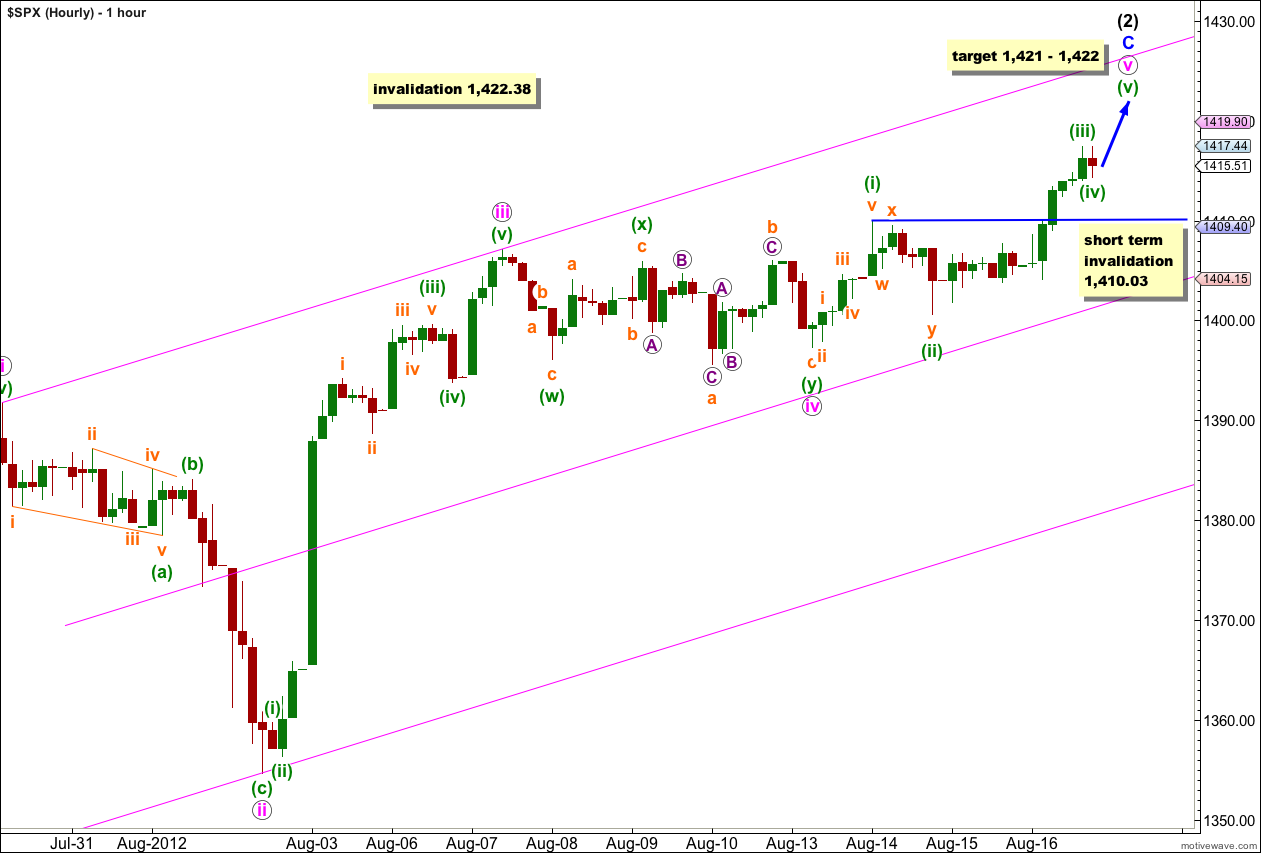
The alternate hourly wave count was invalidated with a new high and this main wave count is the only hourly wave count I have for you today.
On the 5 minute chart upwards movement for Thursday’s session subdivides perfectly into a complete five wave impulse. Wave (iii) green would most likely be over now and a little longer than expected. There is a little room for movement for wave (iv) green.
On the 5 minute chart wave (iv) green is a complete zigzag. This movement may be wave (iv) green in its entirety, or it may be only wave a within wave (iv) green. If wave (iv) green continues lower and sideways it may not move into wave (i) green price territory. This wave count is invalidated with movement below 1,410.03 in the short term.
If wave (iv) green is over then at 1,422 wave (v) green would reach 0.618 the length of wave (i) green. Because there is no Fibonacci ratio between waves (i) and (iii) green it is very likely that we shall see a Fibonacci ratio exhibited between wave (v) green and either of (i) or (iii) green. This target has a good probability.
At 1,421 wave v pink would reach 0.382 the length of wave i pink.
Wave (v) green may last only one session, or part thereof.
If wave (iv) green is complete already then this upwards movement may end tomorrow. If wave (iv) green is not over and it moves price sideways for a while the end to this upwards movement may come next week.
When we have a little more upwards movement which could be considered wave (v) green then the invalidation point at 1,410.03 no longer applies. At that stage we shall be looking to 1,391.74 in the first instance as a price point to indicate a trend change.
It looks like wave (2) black could correct right up to the start of wave (1) black and test our nerves to the limit. Only movement above 1,422.38 would invalidate this wave count, but it would only need to be a fraction of a point. The rule, and this invalidation point, is black and white.
Laura,
A lot of debate on the Daily counts and the 1422 invalidation point. I have a suggestion for an additional perspective on this debate. Clearly we all see that the current daily wave pattern was stronly impulsive down to June 4th then very corrective up through Fri.
If you take a step back and look at the SPX WEEKLY… the suggestion is how would you count that pattern in comparison to the daily wave count. I would suggest 2 periods
1. March 2009-Present
2. October 2011- Present.
What would your weekly target be after looking at those two time periods? Would you keep the same 1422 invalidation point for the current weekly pattern?
I have weekly charts in the SPX historical analysis category. I’ll be going over the relevant charts in today’s analysis.
It’s time to look again at the big picture.
FAZ, TZA, TECS, EDZ, and DRV Confirmed H&S TOPS
The bull flag on ES 15min measure rule to 1426.75. http://thepatternsite.com/flags.html
Lara,
I emailed two pdf. files earlier this month did you get them? Let me know… I will email a new one this weekend again. The ascending broadening wedge should take us to ES 1426.75 soon. Looking for a pivot point bounce ES 1410 area this morning which should be a minor 4.
I did get them, but they’re 15 minute charts and so without seeing the bigger picture about 2 – 3 degrees above that I cannot see why you think 1,422.38 should be breached.
Also, I think you’re looking at futures markets. That will have a different wave count to the cash index I’m analysing.
If you have a chart on daily and / or weekly level please email it to me then I can see what you mean.
Psychologically EVERYONE knows the 1422 level. Which makes it likely to be taken out [Lara we have been here before with examples of levels that are very unlikely to be breached only to be breached. In one particular case the breach (i think it was the last major one) meant that you were then saying the market would go MUCH higher – it didnt it only went a little higher .
I think at the time you were saying we could go to 1500+ (after a breach of a prior high)and in the end we only went to 1422 [i could be wrong but thats my recollection]. So whats my question / point?
Well first of all im not being critical, just stating a fact. My question therefore is, is it possible (if we have a breach of 1422) that the whole down move to 1266 was an A wave and we are now in a B wave of a flat with a C wave to come. If that is possible, the question then becomes what is the possible high in the B wave – e.g minnimum 90% and max 105% of A?
You’re right Craig, we’ve been here before. Which is why I will always look for alternate wave counts and try to see them BEFORE an invalidation point is taken out.
You’re also right on another point. If we see the previous movement ending with a truncated fifth wave (and I’ve had that wave count before for that part) then we have a three down not a five, and this upwards movement could be a B wave.
If that is the case then we would expect upwards movement for a B wave to end between 1,430 (105% of A) and 1,482 (138% of A).
It’s well passed the minimum 90% at this stage.
It would look a bit strange, but it’s technically possible.
This comments seems to strengthening Lara analysis… we are at the end of a wave 2 :).
It does look like that would be the case.
As the analysis today stated, second waves tend to convince us there has been no trend change, particularly if they are very deep as this one is.
We shall know in another couple of sessions I expect.
Any way we are in a 5th wave up now vs 2nd wave? I think 3rd waves only develop from a head and shoulders top which we don’t have yet. I predict a 5th wave up before the downtrend starts this Fall.
It’s not a 5th wave vs a 2nd wave, it’s the very final 5th wave within a 2nd wave.
Although a head and shoulders is a classic technical analysis pattern which predicts a reversal, this is not an Elliott wave pattern and so from the point of view of this analysis it is not required.
However, you can see the formation of a head and shoulders pattern on the monthly chart: the left hand shoulder has it’s high at 1,370.58 on 1st May, 2011, the head is the high at 1,422.38 on 1st April 2012 and the right shoulder is finishing. So far, as long as 1,422.38 is not breached, this structure meets the guidelines as far as I can tall for a H&S pattern.
As a side note, a typical H&S pattern is formed by the ends of a third, fourth and fifth wave (left hand shoulder and head), then a following first and second wave (right hand shoulder) so I would say that a H&S pattern fits perfectly within Elliott wave. Using EW rules and guidelines may provide more accuracy though as they are clearer and have price points beyond which the wave count is invalid.
NOTE: Most “bulls” will see the count going to 1553.00, but once everyone has happy feet and only can see the market going up. They will sell and this time it will not stop after 5 days like last Thanksgiving.
Lara, I hope you do not delete this message again.
“An invalidation of this wave count would be hugely significant and it would change the picture at cycle degree.” —- Agreed
My three brothers that work in banking have said we will see 1440.00 and they are NOT selling until Thanksgiving. This can push the market into 1553.00. They said to buy the dips down to the EMA(13) on minor retrace waves.
I hope you take this message in the right way and help me with the count once yours get invalidated.
Thank you for all your help.
I deleted the last message because it made a statement of what you expect the market to do, with no supporting evidence of why it would do that. Divergence is usually an indicator of a trend change, not usually more of the same.
So I will ask if you state you expect the market to reach to 1,440 then why? What indicators are you using? What alternate wave count are you considering?
Evidence for the assertion would add very much to the discussion. Then we could all consider and weigh up your contribution with our own analysis.
I’ll be looking at the monthly chart over the weekend. I have the one wave count which expects a new all time high, but I want to see if I can see another explanation of movement above 1,422.38