
Yesterday’s analysis of the S&P 500 cash index expected a new high as most likely during Wednesday’s session which is exactly what happened.
At this stage the alternate daily wave count remains technically valid, but it looks very strange and unlikely I will not publish it anymore. We will use just the one daily chart.
I have two hourly charts looking at Wednesday’s movement slightly differently. We may use confirmation / invalidation points to work with these two charts tomorrow. The main hourly wave count has a higher probability.
Click on the charts below to enlarge.
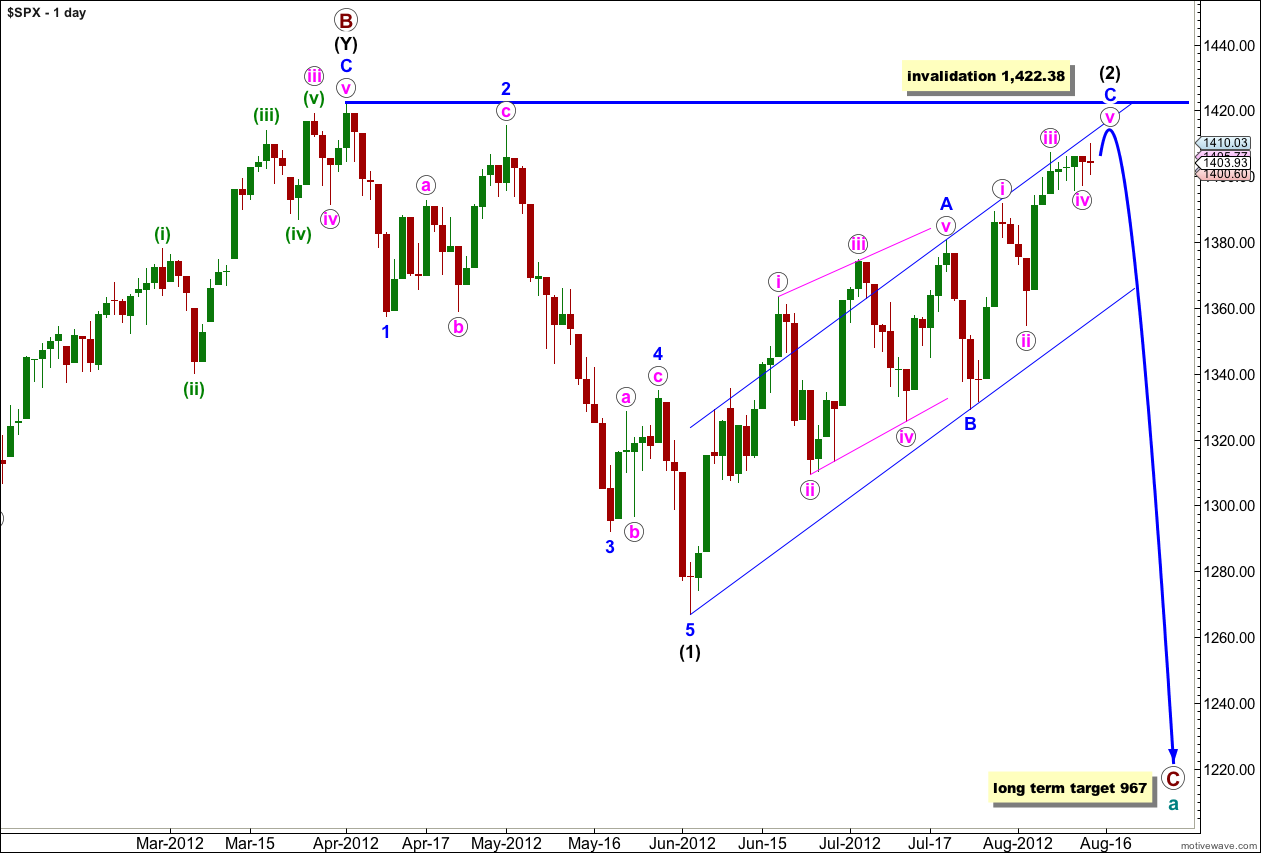
If wave (2) black is a single zigzag then wave A blue was a leading diagonal and it would be likely that wave C blue would be an impulse to see alternation between the two.
We may use Elliott’s channeling technique to draw a parallel channel about wave (2) black. When this channel is breached by downwards movement we should have confirmation of a trend change. Prior to confirmation of a trend change we must accept the possibility of new highs.
When wave C blue is confirmed as complete then the only way that wave (2) black could continue further would be as a very rare triple zigzag. The rarity of triples means the probability of wave (2) black continuing further is extremely low. Also, for the S&P 500 to continue further within this correction it would diverge significantly with the Dow. For the Dow the only corrective structure which fits the upwards movement and meets all rules is a triple zigzag, so when this last movement is over the correction cannot continue further.
Wave (2) black may not move beyond the start of wave (1) black. This wave count is invalidated with movement above 1,422.38.
Main Hourly Wave Count.
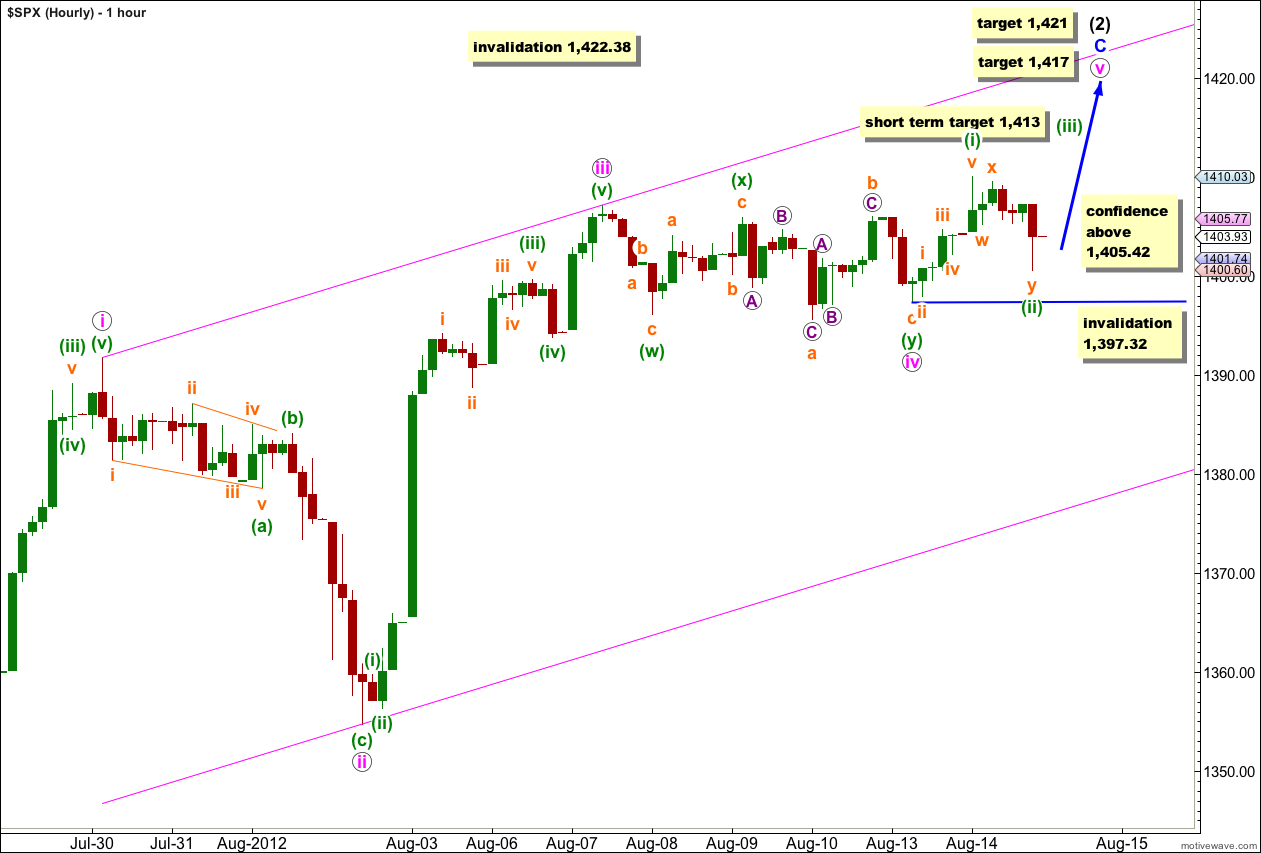
Movement above 1,407.14 confirmed this hourly wave count and invalidated the alternate. At that stage we expected further upwards movement.
The targets at 1,417 and 1,421 have a good probability. There is no Fibonacci ratio between waves i and iii pink and it is very likely we shall see a Fibonacci ratio between wave v pink and either of i or iii pink.
At 1,417 wave v pink would reach 0.382 the length of wave iii pink. If price continues to rise through this first target then the next likely target is at 1,421 where wave v pink would reach 0.382 the length of wave i pink.
Within wave v pink so far only wave (i) green may be complete. Wave (ii) green may be a complete double zigzag structure, and this subdivision fits best when viewed on the 5 minute chart.
Tomorrow, if we see movement above 1,405.42, this main hourly wave count would increase in probability. At that stage the downwards movement labeled (ii) green could not be a continuing five wave impulse as price would have entered wave one territory (as viewed on the 5 minute chart).
Movement above 1,410.03 would confirm this main hourly wave count and invalidate the alternate below.
On the 5 minute chart downwards movement subdivides best into three wave structures, and wave x orange is best seen as a flat correction. Because there is most likely a flat within this downwards movement it is most likely this main wave count is correct. The alternate requires this movement to be seen as a zigzag. This increases the probability that this main wave count is correct.
At 1,413 wave (iii) green would reach equality with wave (i) green. Thereafter, a very shallow fourth wave correction may not move back into wave (i) green price territory.
Alternatively wave v pink may be unfolding as an ending diagonal, but at this stage the subdivisions don’t seem to fit on the 5 minute chart. I have not charted this possibility for you today as it seems unlikely.
Wave (2) black may not move beyond the start of wave (1) black. This wave count is invalidated with movement above 1,422.38.
Alternate Hourly Wave Count.
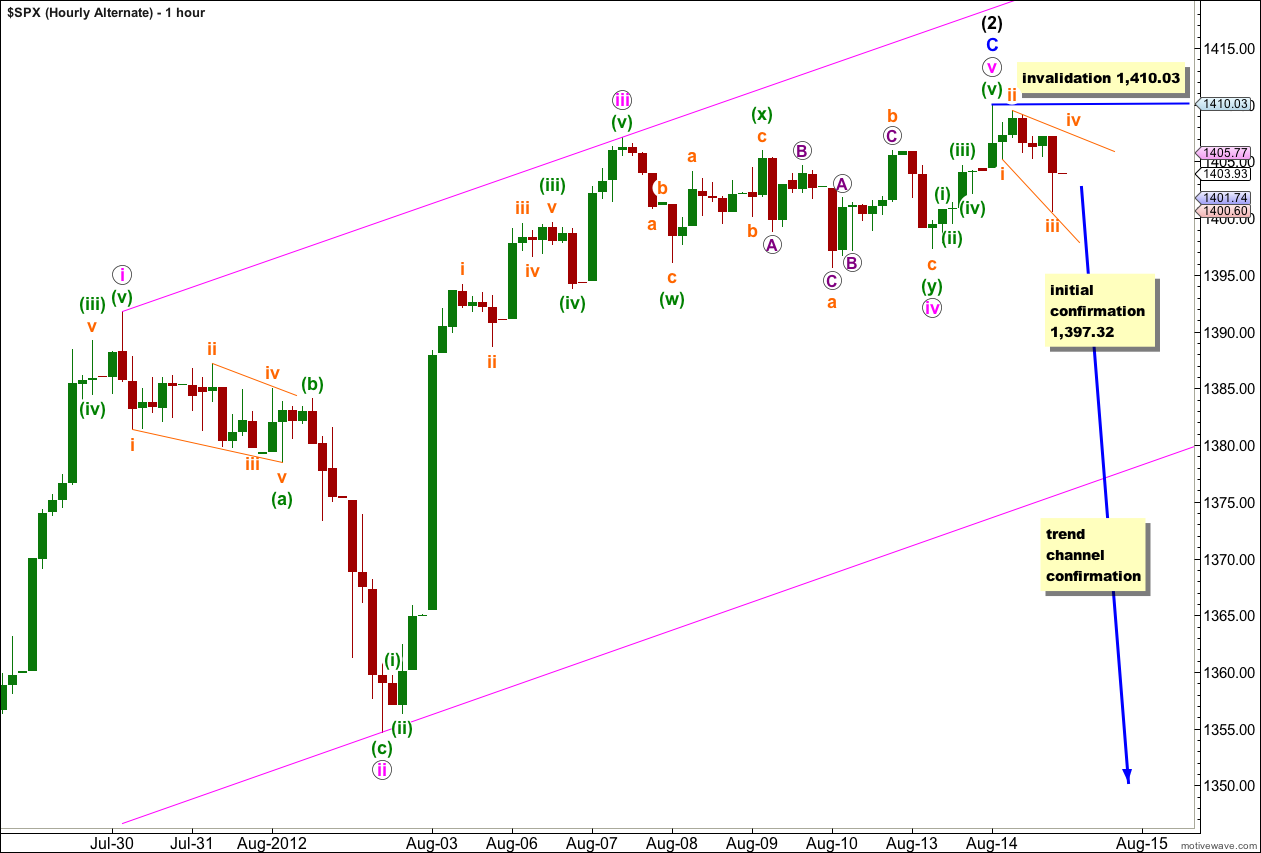
If we simply move the degree of labeling within Wednesday’s upwards movement all up one degree we can see a complete five wave structure for wave C blue. Wave v pink may have been very brief and may be over already.
Ratios within wave C blue are: wave iii pink has no Fibonacci ratio with wave i pink, and wave v pink is just 0.32 points longer than 0.236 the length of wave iii pink.
If price moves below 1,397.32 tomorrow then this alternate wave count would be correct and the main wave count invalidated. At that stage I would want to wait for trend channel confirmation on the hourly chart to have confidence in a trend change at intermediate degree.
A channel breach on the daily chart would provide enough confidence in a trend change to calculate a target for wave (3) black downwards.
Within wave (3) black downwards no second wave correction may move beyond the start of its first wave. This wave count is invalidated with movement above 1,410.03.
Thank god… I thought i had missed a day and ended up in an “alternate” parallel universe!
So many time zones and so little time!
ive only just woken up but wasnt yesterday Tuesday the 14th August?
Oh my goodness!! Yes, you’re right.
I’m confused. It’s Wednesday here.
Yes, this analysis is for Tuesday the 14th.