
With the SPX500 moving sideways the situation is unchanged since last analysis.
I still have two wave counts which expect the same movement next. Targets and invalidation points are the same.
After the next movement is completed then the wave counts diverge and we will use a confirmation / invalidation point to differentiate between them.
Click on the charts below to enlarge.
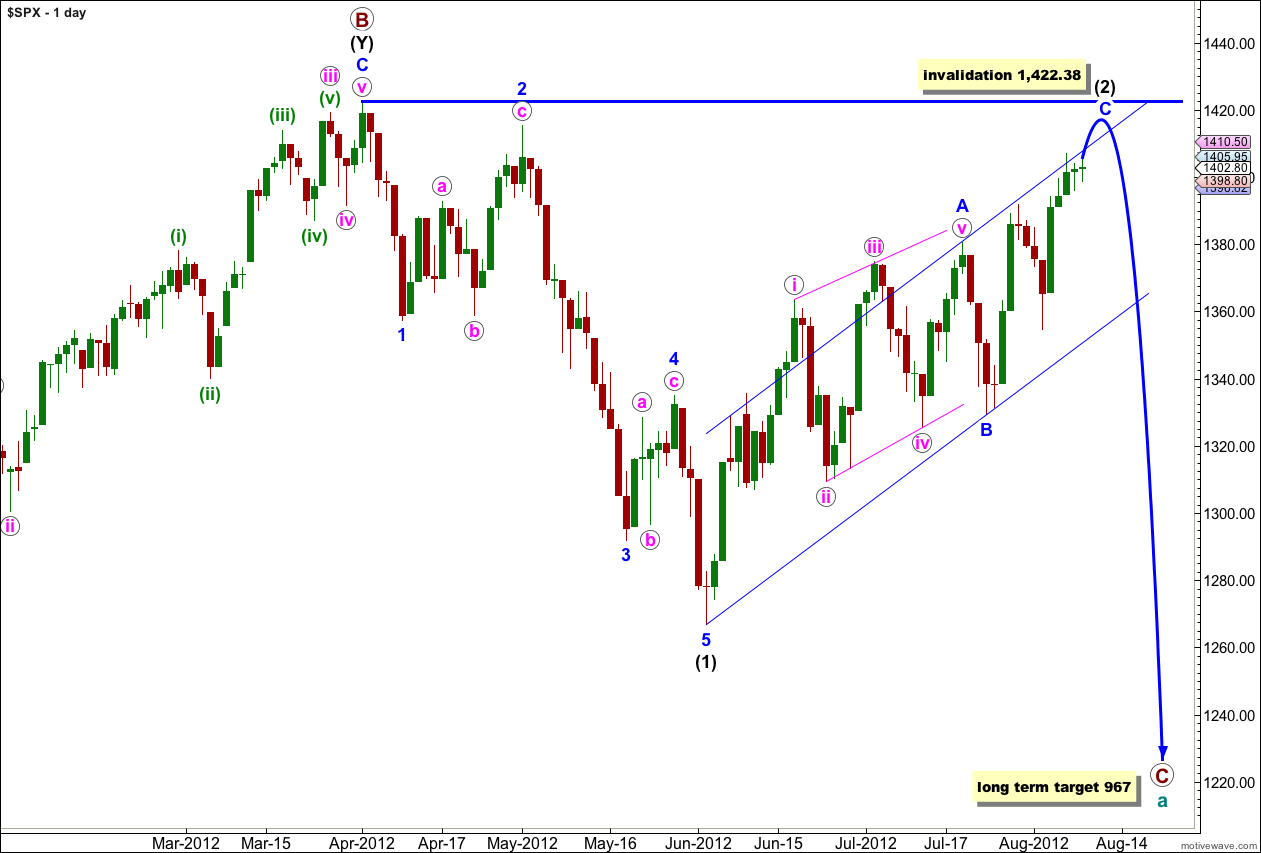
If wave (2) black is a single zigzag then wave A blue was a leading diagonal and it would be likely that wave C blue would be an impulse to see alternation between the two.
We may use Elliott’s channeling technique to draw a parallel channel about wave (2) black. When this channel is breached by downwards movement we should have confirmation of a trend change. Prior to confirmation of a trend change we should expect more upwards movement.
When wave C blue is confirmed as complete then the only way that wave (2) black could continue further would be as a very rare triple zigzag. The rarity of triples means the probability of wave (2) black continuing further is extremely low. Also, for the S&P 500 to continue further within this correction it would diverge significantly with the Dow. For the Dow the only corrective structure which fits the upwards movement and meets all rules is a triple zigzag, so when this last movement is over the correction cannot continue further.
Wave (2) black may not move beyond the start of wave (1) black. This wave count is invalidated with movement above 1,422.38.
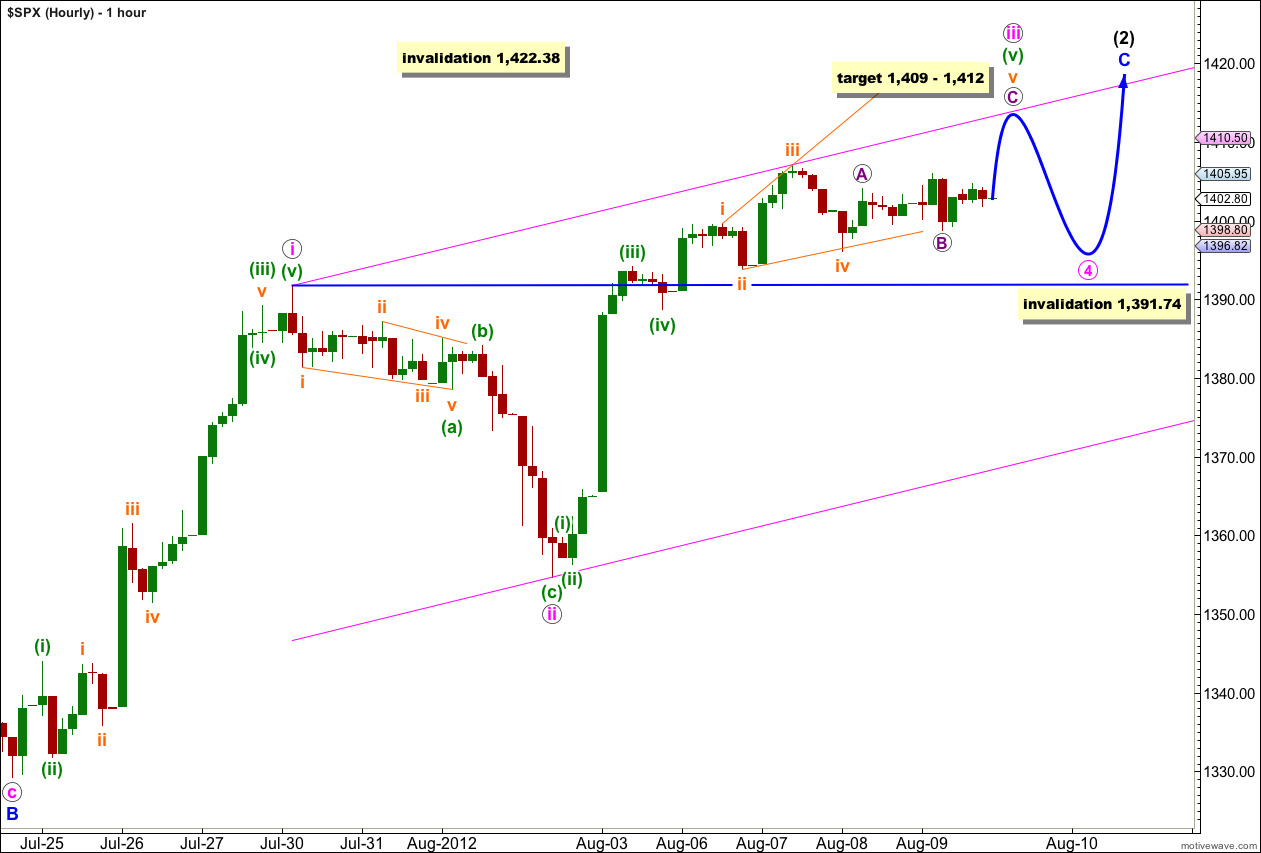
The current upwards movement is still incomplete. The final fifth wave within wave iii pink looks to be unfolding as an ending diagonal.
At 1,409 wave v orange would reach equality with wave iii orange. Because the diagonal is expanding it is very likely price will reach to this target, or a little above.
At 1,412 wave (v) green would reach 0.618 the length of wave (iii) green.
Thereafter, this main wave count diverges from the alternate. This main wave count expects a short term trend change to the downside for a fourth wave for iv pink which may not move into wave i pink price territory below 1,391.74. At that stage, if price does not move below the invalidation point, this main wave count will remain valid. If price does move below this point the alternate will be the likely explanation and we would expect a trend change at intermediate degree would be possible.
This main wave count expects wave iv pink to be mostly sideways moving, lasting about two or so sessions. Thereafter, a final upwards fifth wave would end wave (2) black.
Overall this main wave count expects another one to two weeks or so of generally trending upwards movement and sideways movement before a big trend change.
Alternate Wave Count.
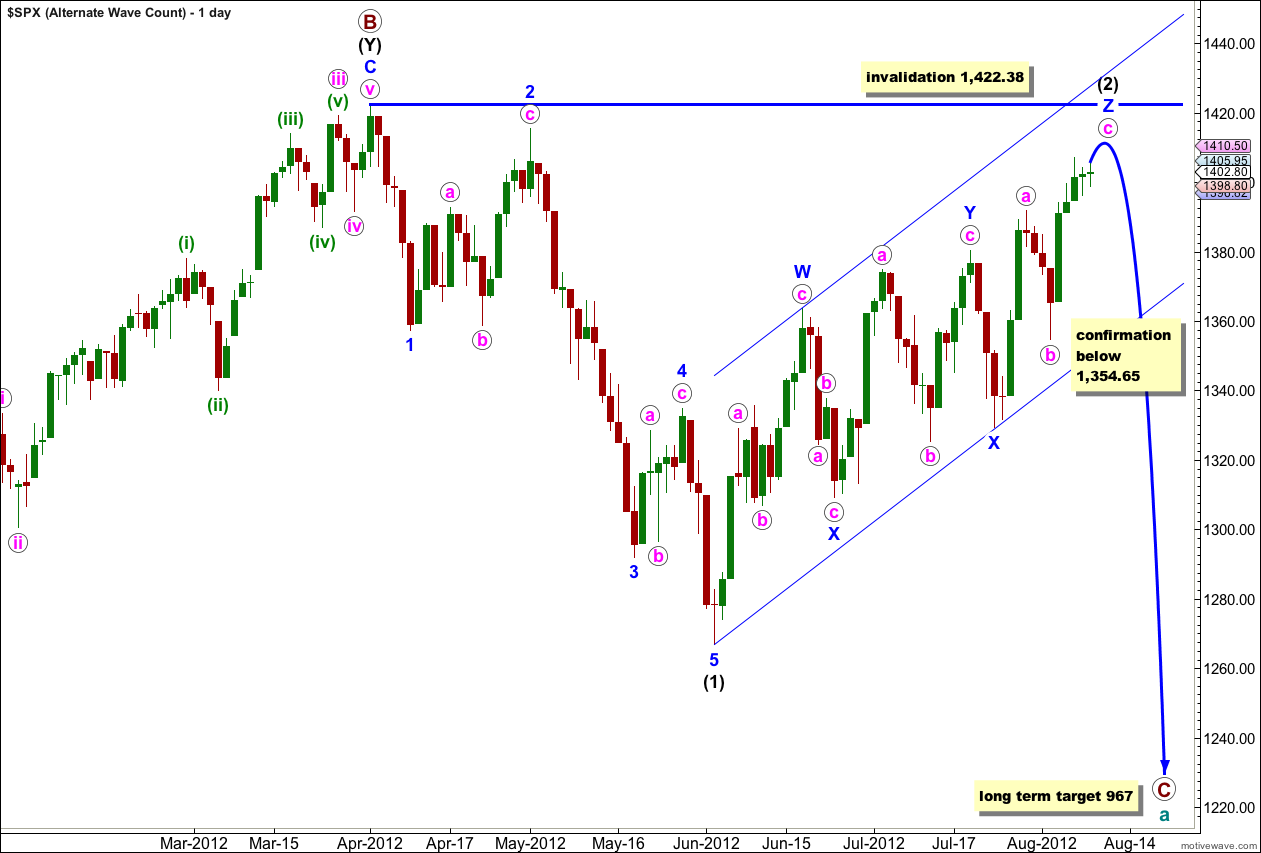
It is also possible that wave (2) black is a very rare triple zigzag. Although the rarity of this structure reduces the probability of this wave count, it is valid and all subdivisions do fit.
If this is correct then the final wave c pink of wave Z blue may be almost complete. Downwards movement below the start of wave c pink at 1,354.65 would confirm a trend change.
Wave (2) black may not move beyond the start of wave (1) black. This wave count is invalidated with movement above 1,422.38.
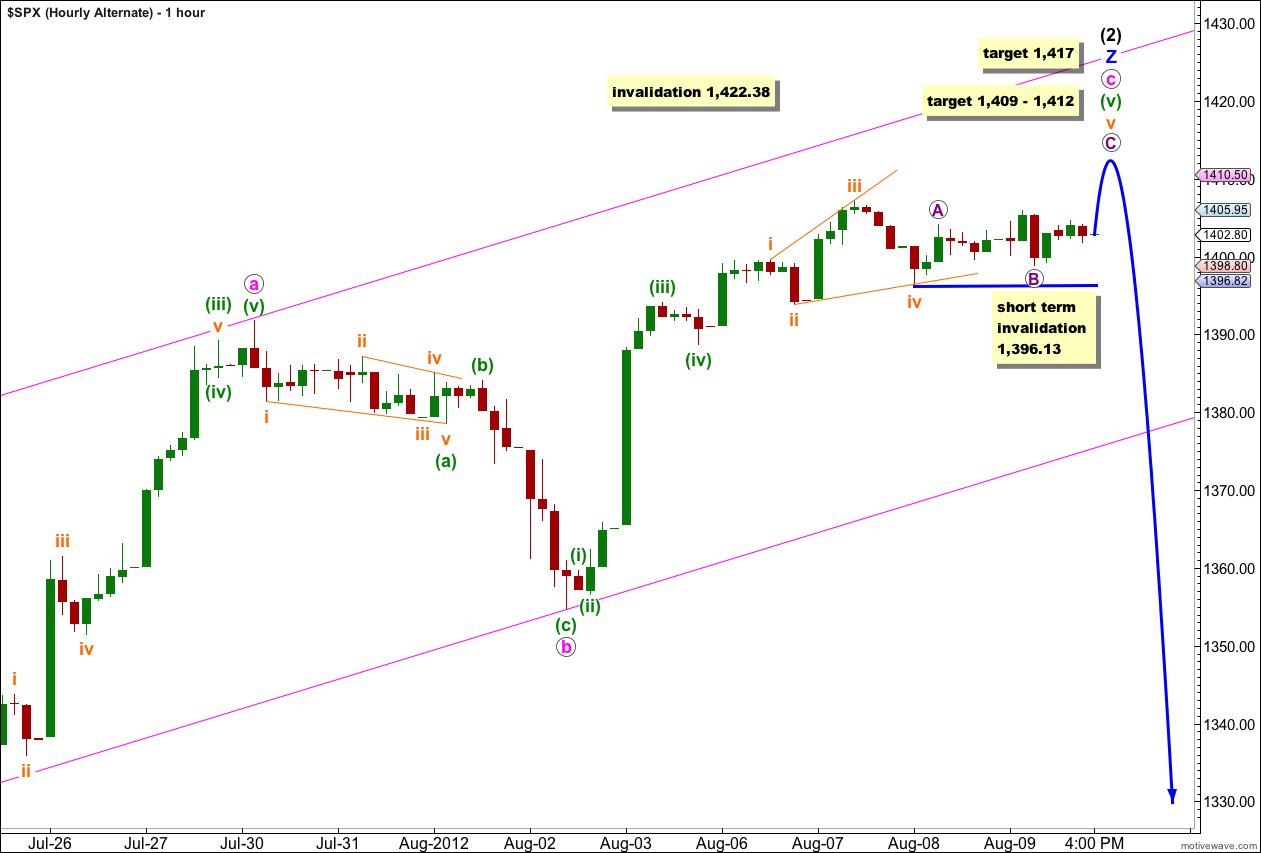
Wave (v) green of wave iii pink is unfolding as an ending expanding diagonal. The final fifth wave, wave v orange, within it is taking its time.
At 1,409 wave v orange would reach equality with wave iii orange. Because the diagonal is expanding it is very likely price will reach to this target, or a little above.
At 1,412 wave (v) green would reach 0.618 the length of wave (iii) green.
At 1,417 wave c pink would reach equality with wave a pink. If the first target is met and price continues higher then this second target would be likely.
In the short term when markets open tomorrow any further downwards movement within wave v orange for wave B purple may not move beyond the start of wave A purple. This short term invalidation point only applies until we see a new high above 1,407.14.
Very nice counting of a highly difficult and unique corrective process. With this amount of time and bullish effort I am thinking of the possibility of something bigger than an intermediate three down at the end of it.
Means a different long term count that I don’t want changed until it becomes more clear but would not be surprised if something bigger drops at the end of this.
Thank you very much!