
The main wave count for last analysis expected upwards movement. So far price has fallen 3.86 points short of the first target at 1,411.
I still have two wave counts today. At this stage they do not diverge.
Click on the charts below to enlarge.
Main Wave Count.
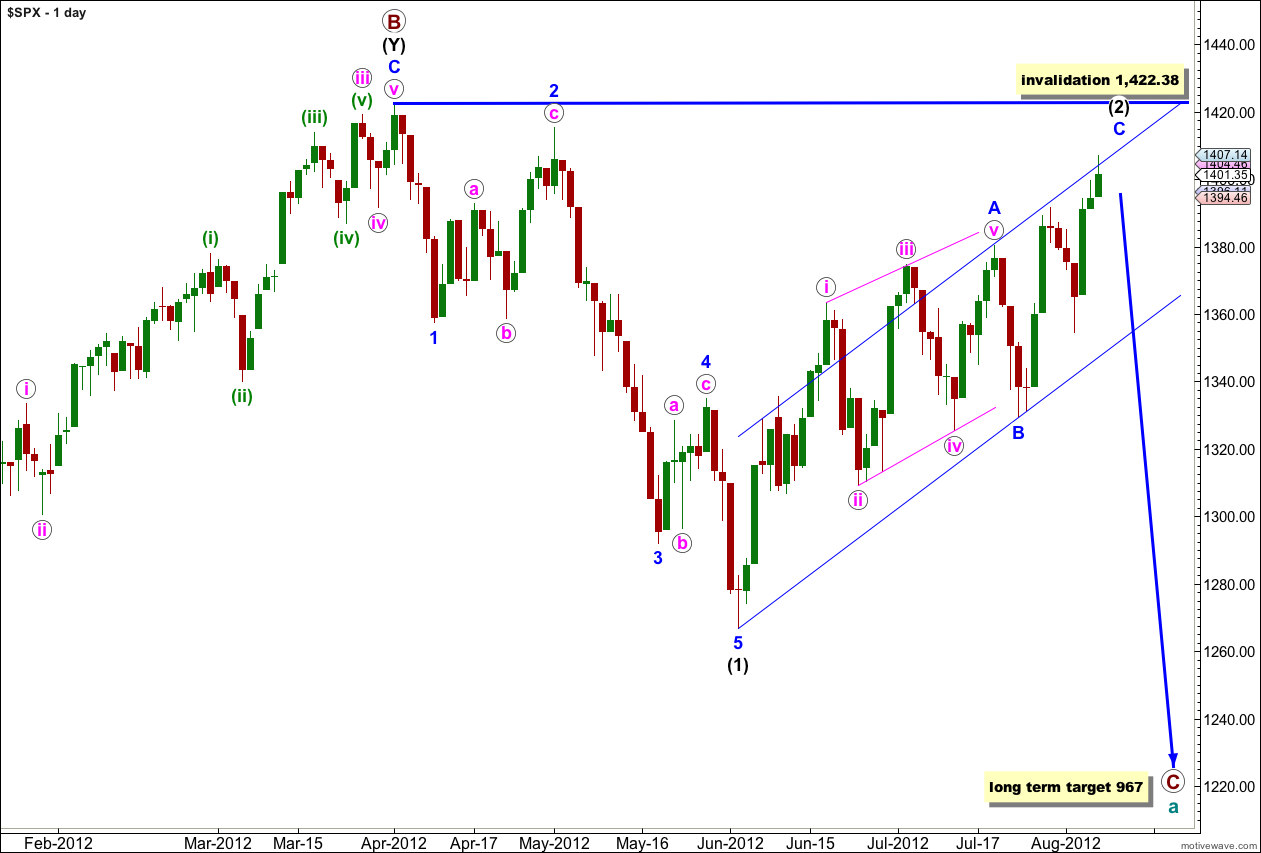
Within wave (2) black wave A blue was a leading diagonal and it would be likely that wave C blue would be an impulse to see alternation between the two.
We may use Elliott’s channeling technique to draw a parallel channel about wave (2) black. When this channel is breached by downwards movement we should have confirmation of a trend change. Prior to confirmation of a trend change we should expect more upwards movement.
When wave C blue is confirmed as complete then the only way that wave (2) black could continue further would be as a very rare triple zigzag. The rarity of triples means the probability of wave (2) black continuing further is extremely low. Also, for the S&P 500 to continue further within this correction it would diverge significantly with the Dow. For the Dow the only corrective structure which fits the upwards movement and meets all rules is a triple zigzag, so when this last movement is over the correction cannot continue further.
Wave (2) black may not move beyond the start of wave (1) black. This wave count is invalidated with movement above 1,422.38.
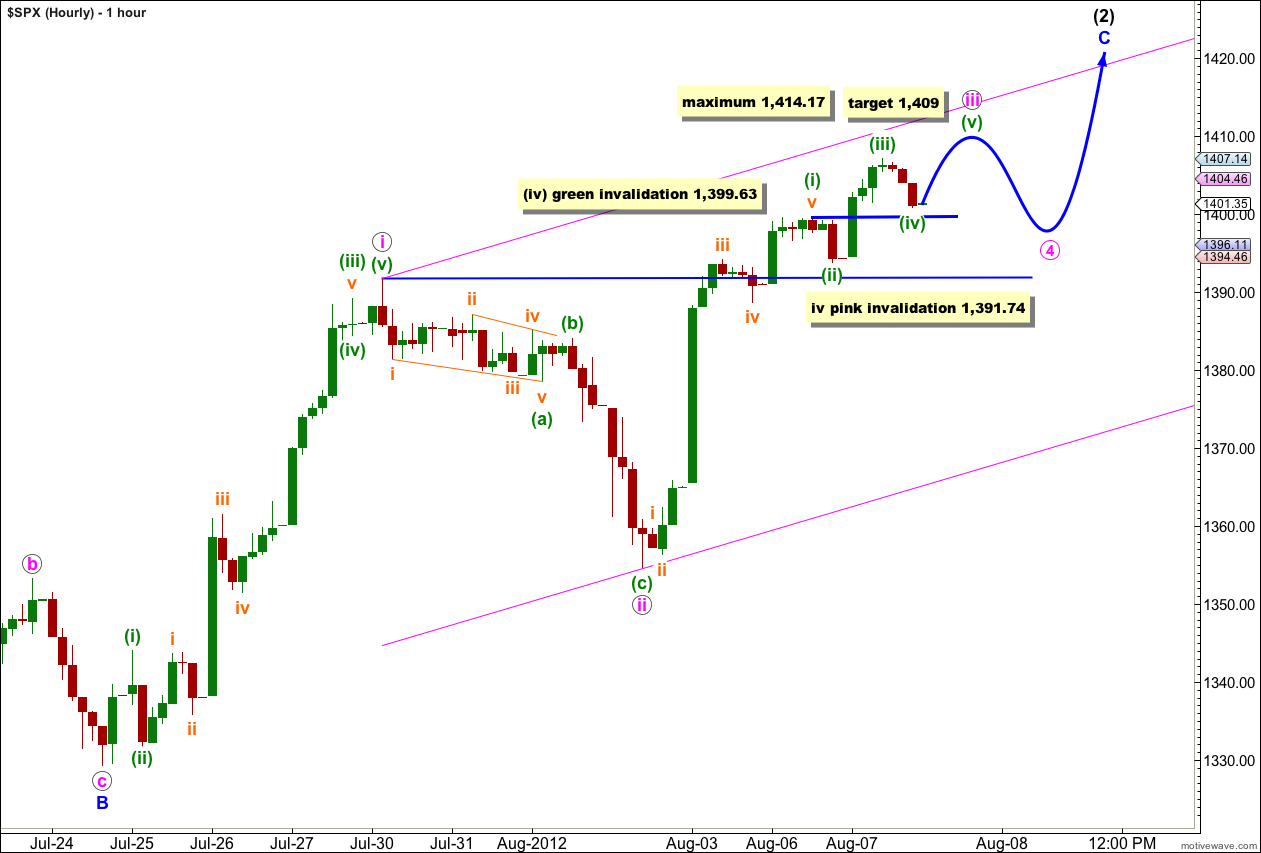
I have adjusted the wave count within this third wave for iii pink. I do not think the small correction labeled now wave (ii) green was wave iv pink because it was so out of proportion to wave ii pink. It looks like wave iii pink is not yet over and is extending.
Within wave iii pink wave (i) green may have been the extended wave. When markets open tomorrow if price does not move below 1,399.63 this wave count will remain valid, as wave (iv) green may not move into wave (i) green price territory.
At 1,409 wave (v) green would reach 0.618 the length of wave (iii) green. Because wave (iii) green is shorter than wave (i) green wave (v) green has a maximum length of equality with wave (iii) green. This maximum point is at 1,414.17.
Thereafter, this wave count expects downwards and sideways movement for wave iv pink. Wave iv pink may not move into wave i pink price territory. This wave count is invalidated at that stage with movement below 1,391.74.
This wave count expects overall upwards movement for another few sessions.
Alternate Wave Count.
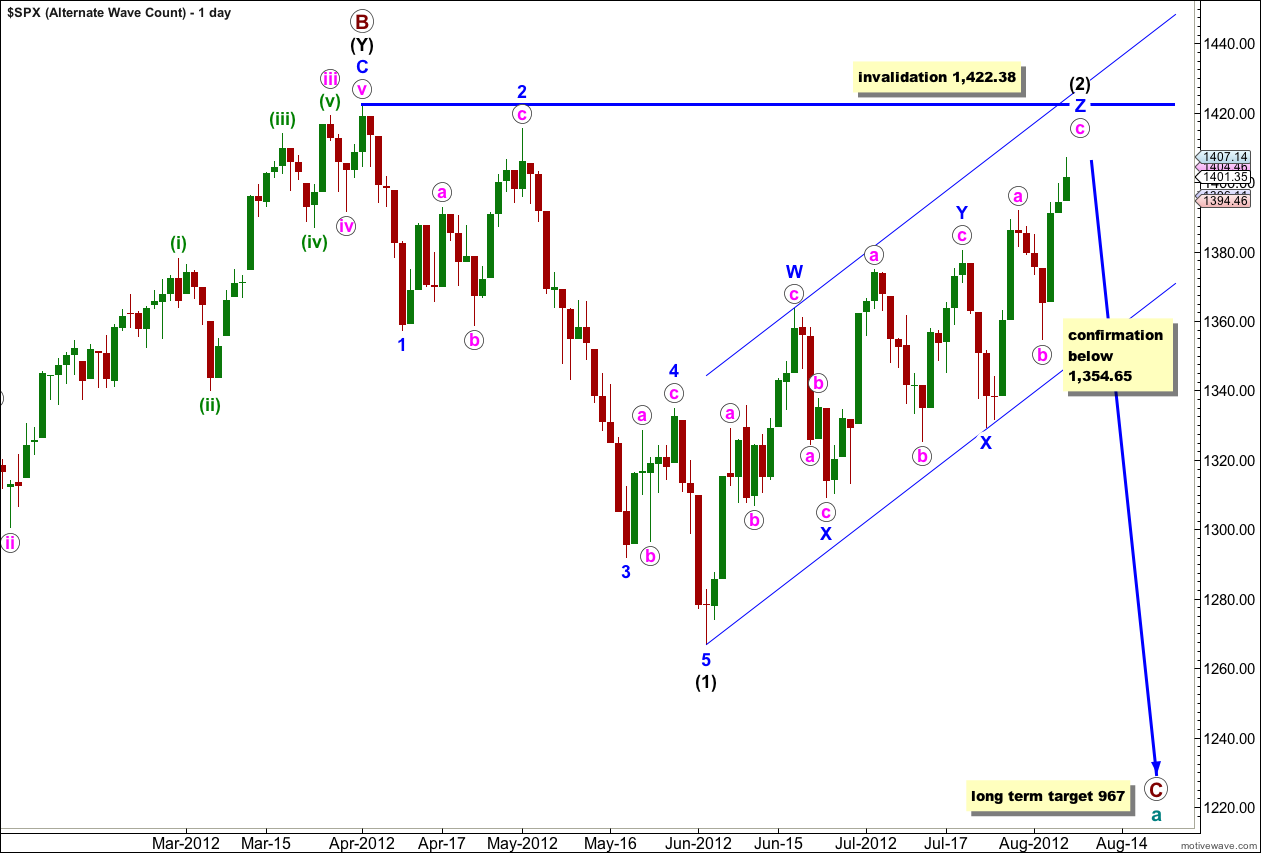
It is also possible that wave (2) black is a very rare triple zigzag. The rarity of this structure reduces the probability of this wave count, but it is valid and all subdivisions do fit.
If this is correct then the final wave c pink of wave Z blue may be almost complete. Downwards movement below the start of wave c pink at 1,354.65 would confirm a trend change.
Wave (2) black may not move beyond the start of wave (1) black. This wave count is invalidated with movement above 1,422.38.
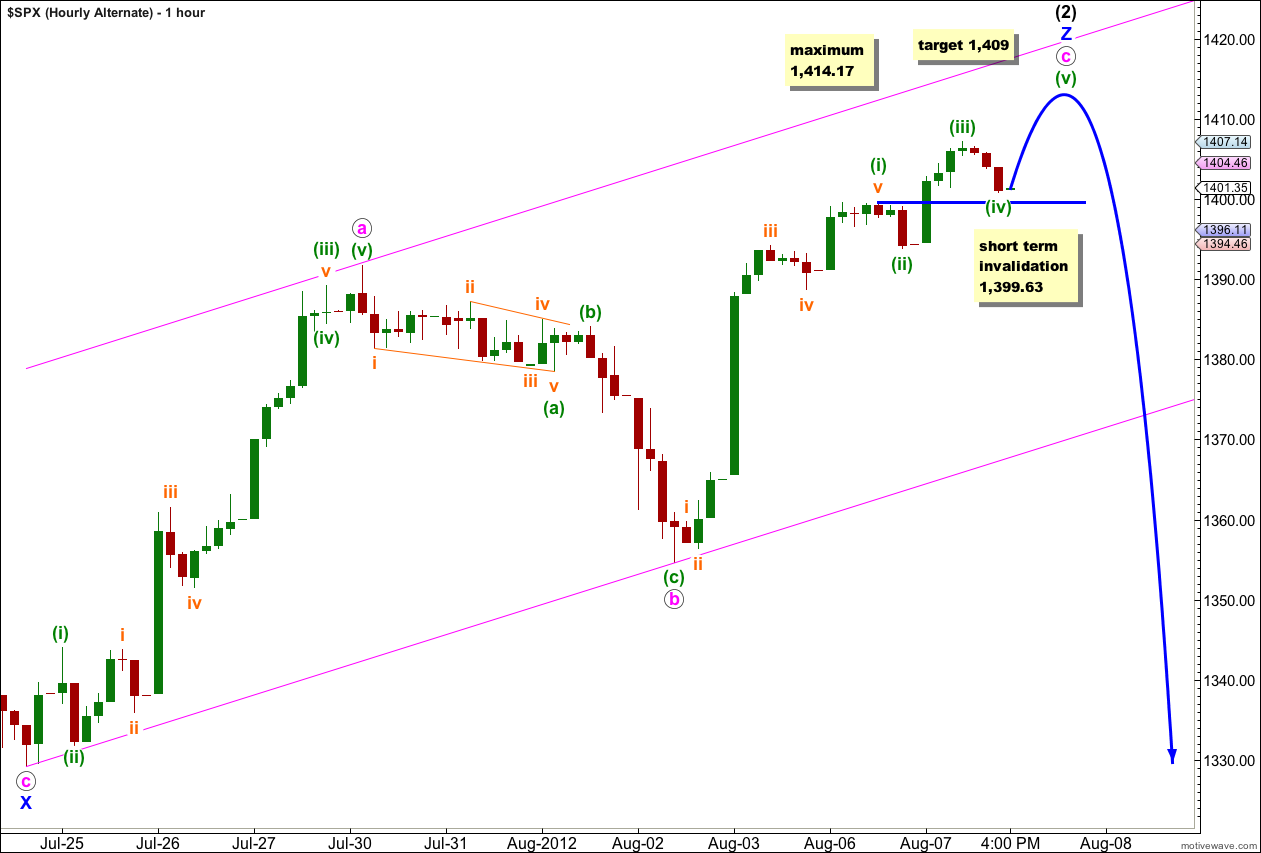
I have adjusted the structure within wave c pink in the same way as the main hourly wave count. This upwards movement looks like an incomplete impulse with an extended first wave labeled (i) green.
For this alternate wave c pink may be over tomorrow or the day after with one final upwards fifth wave.
When markets open tomorrow any downwards movement for wave (iv) green may not move into wave (i) green price territory. This wave count is invalidated (at least my labeling of the structure within wave c pink would be wrong) with movement below 1,399.63.
At 1,409 wave (v) green within wave c pink would reach 0.618 the length of wave (iii) green. Wave (v) green may not be longer than equality with wave (iii) green because the third wave may not be the shortest wave. Wave (v) green has its maximum length at 1,414.17.
When a final upwards wave is complete we should expect a trend change. At that stage the parallel channel drawn here about wave Z blue would provide confirmation of a trend change when it is clearly breached by downwards movement.
Lara,
With the invalidation this morning, I am wondering if what we are seeing is an ending diagonal for the fifth wave at green degree of pink c of blue Z (I think your original labeling where the recent surge was green iii rather than orange iii may have been correct).
What do you think?
Peter
It looks too weird. It just looks wrong. I would be trying to see a three as a five.
Its not possible that C blue was over as an odd looking ending diagonal either, the third wave would be the shortest.
Sorry Peter, I see what you mean. I was looking at the main count first.
Yes, if the alternate is correct and this is a C wave upwards then it has an ending diagonal for the fifth wave unfolding.
So we still need one final upwards thrust at least to finish it, which would probably make a new high.
This makes the main wave count look very odd indeed, so I will be swapping them over today.
Is it possible to email out members or post a new chart when the count gets invalidated 1st thing in the morning? Thank you…
That is a reasonable request, except I live in New Zealand. New York opens 1am my time when I’m fast asleep.
So its not possible.
Looks like one big Symmetrical Triangle (weekly) going back to 10/8/2007 high of 1576.00 and we hit the top trend line yesterday.
Only over this line would be a great place to stay long to me ES 1392 this morning.
Last night we had Chevron’s California Refinery “Immediate-Extreme-Health-Hazard” Fire Emergency which shot up CL (oil).
And pushed us up overbought and deeper into RSI divergence http://scharts.co/QIHZnZ after looking at this chart. It looks to me that we have to back test the 50% Fib 1380.90 1st. Then I would look to make new 52 week highs… What do you think??