
Last analysis expected Friday’s session to begin with a little upwards movement, but not nearly as much as we got. Upwards movement quickly invalidated the hourly wave count although the daily wave count remains valid.
This invalidation illustrates again why it is a good idea to wait for confirmation of a trend change. Prior to confirmation there will always be the possibility that there has been no trend change and new price extremes will be seen.
Click on the charts below to enlarge.
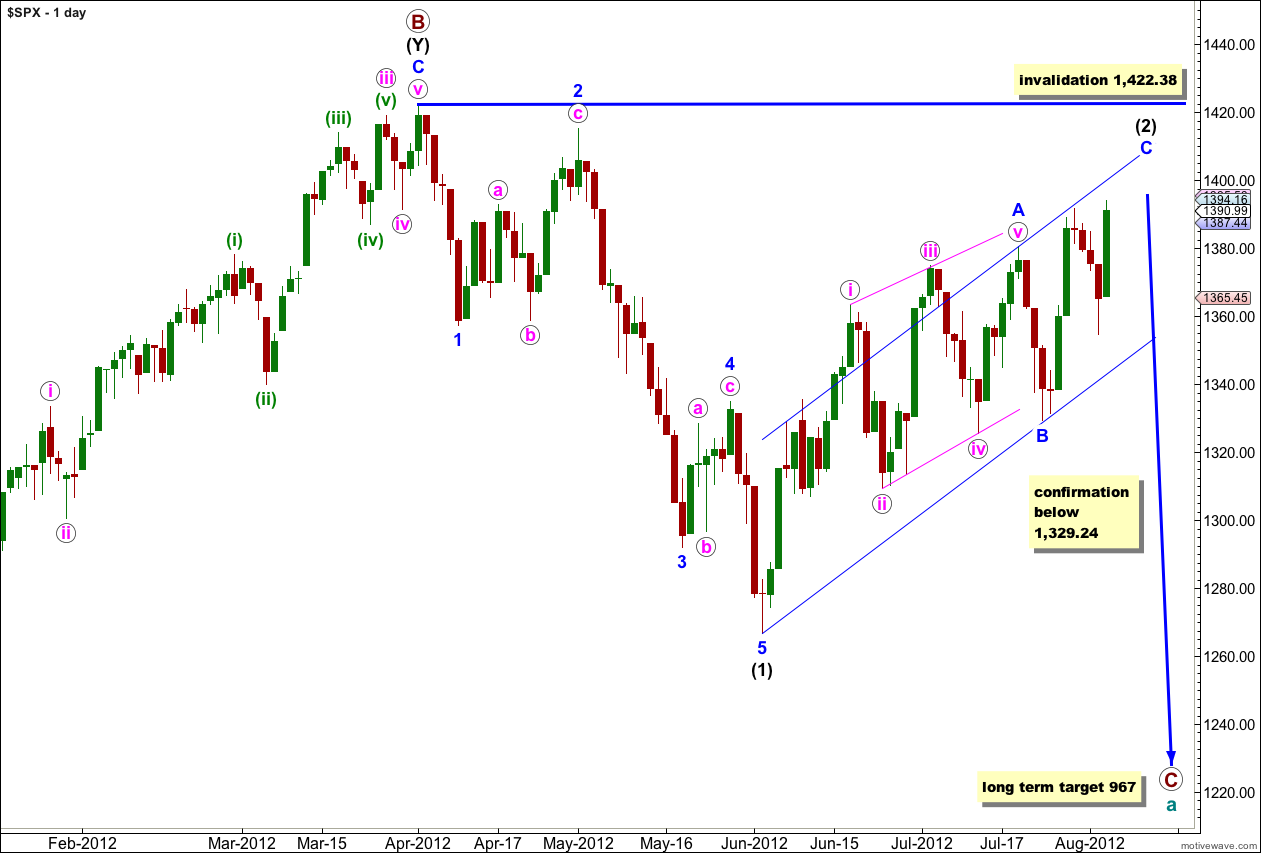
Within wave (2) black wave A blue was a leading diagonal so it would be likely that wave C blue would be an impulse to see alternation between the two. With price movement above 1,391.74 wave C blue cannot be over.
We may use Elliott’s channeling technique to draw a parallel channel about wave (2) black. When this channel is breached by downwards movement we should have confirmation of a trend change. Until we have some confirmation of a trend change we must accept the possibility of new upwards movement.
When wave C blue is confirmed as complete then the only way that wave (2) black could continue further would be as a very rare triple zigzag. The rarity of triples means the probability of wave (2) black continuing further is extremely low. Also, for the S&P 500 to continue further within this correction it would diverge significantly with the Dow. For the Dow the only corrective structure which fits the upwards movement and meets all rules is a triple zigzag, so when this last movement is over the correction cannot continue further.
Wave (2) black may not move beyond the start of wave (1) black. This wave count is invalidated with movement above 1,422.38.
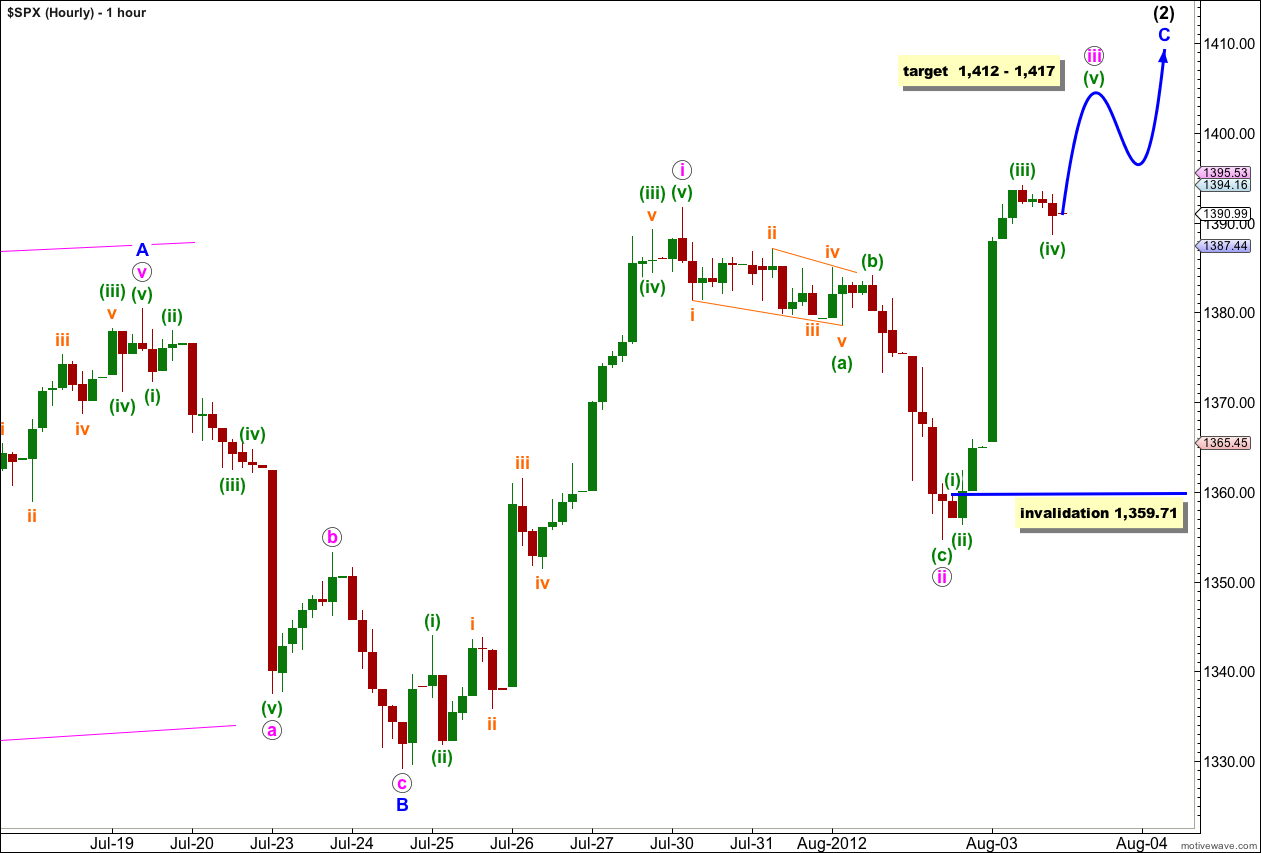
With movement above 1,391.74 the easiest alternate to see is simply moving everything within wave C blue down one degree, and only wave i pink within wave C blue is complete. This wave count requires wave C blue to continue further as a impulse.
At 1,417 wave iii pink would reach 0.618 the length of wave i pink. At 1,412 wave (v) green would reach 0.618 the length of wave (iii) green.
Thereafter, wave iv pink must move price lower but not back into wave i pink price territory.
When markets open on Monday any further downwards movement within wave (iv) green may not move price into wave (i) green price territory. This wave count is invalidated with movement below 1,359.71.
This main wave count expects further upwards movement overall for about another week or so.
Alternate Wave Count.
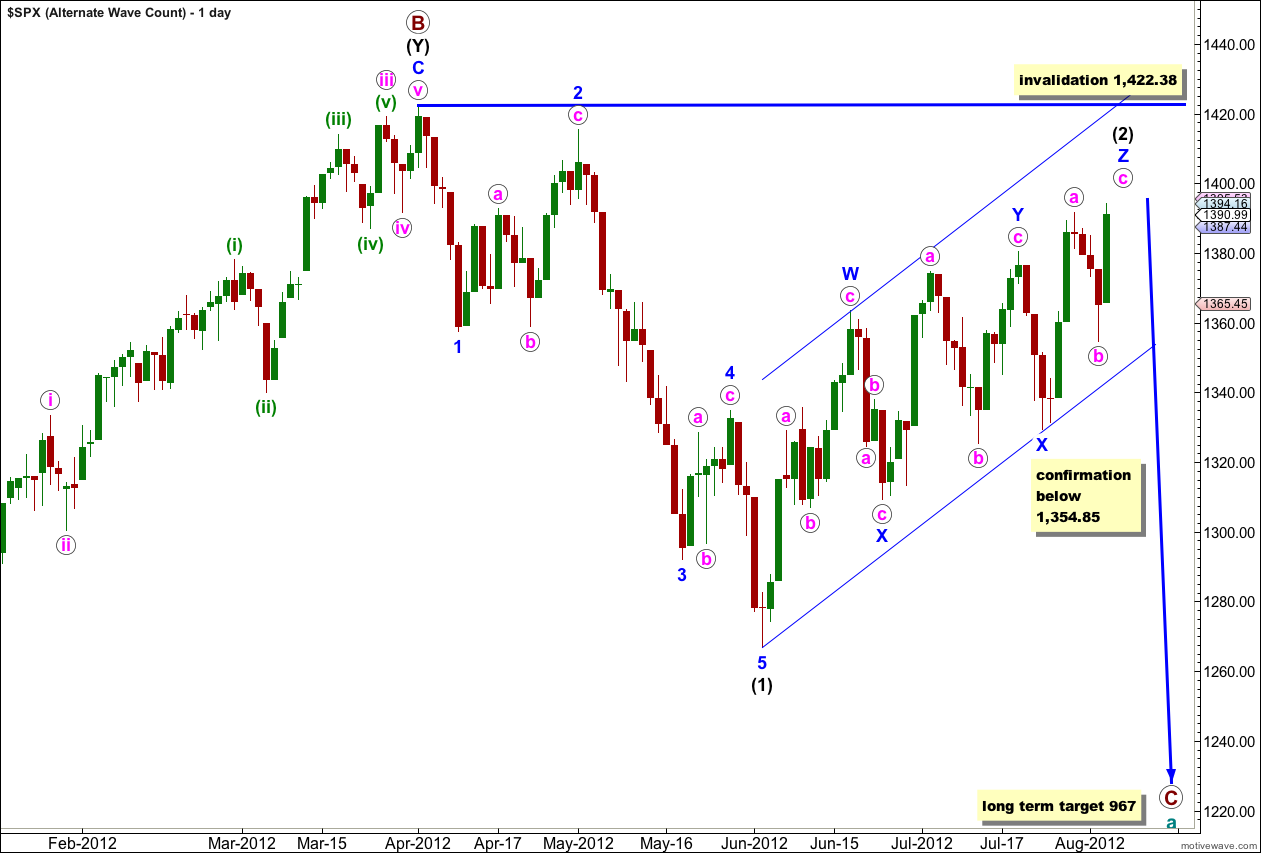
It is also possible that wave (2) black is a very rare triple zigzag. The rarity of this structure reduces the probability of this wave count, but it is valid and all subdivisions do fit.
If this is correct then the final wave c pink of wave Z blue would be close to completion. When it is complete then subsequent downwards movement below the start of wave c pink at 1,354.85 would confirm a trend change.
This alternate wave count expects only another one or two sessions of upwards movement before a trend change.
Wave (2) black may not move beyond the start of wave (1) black. This wave count is invalidated with movement above 1,422.38.
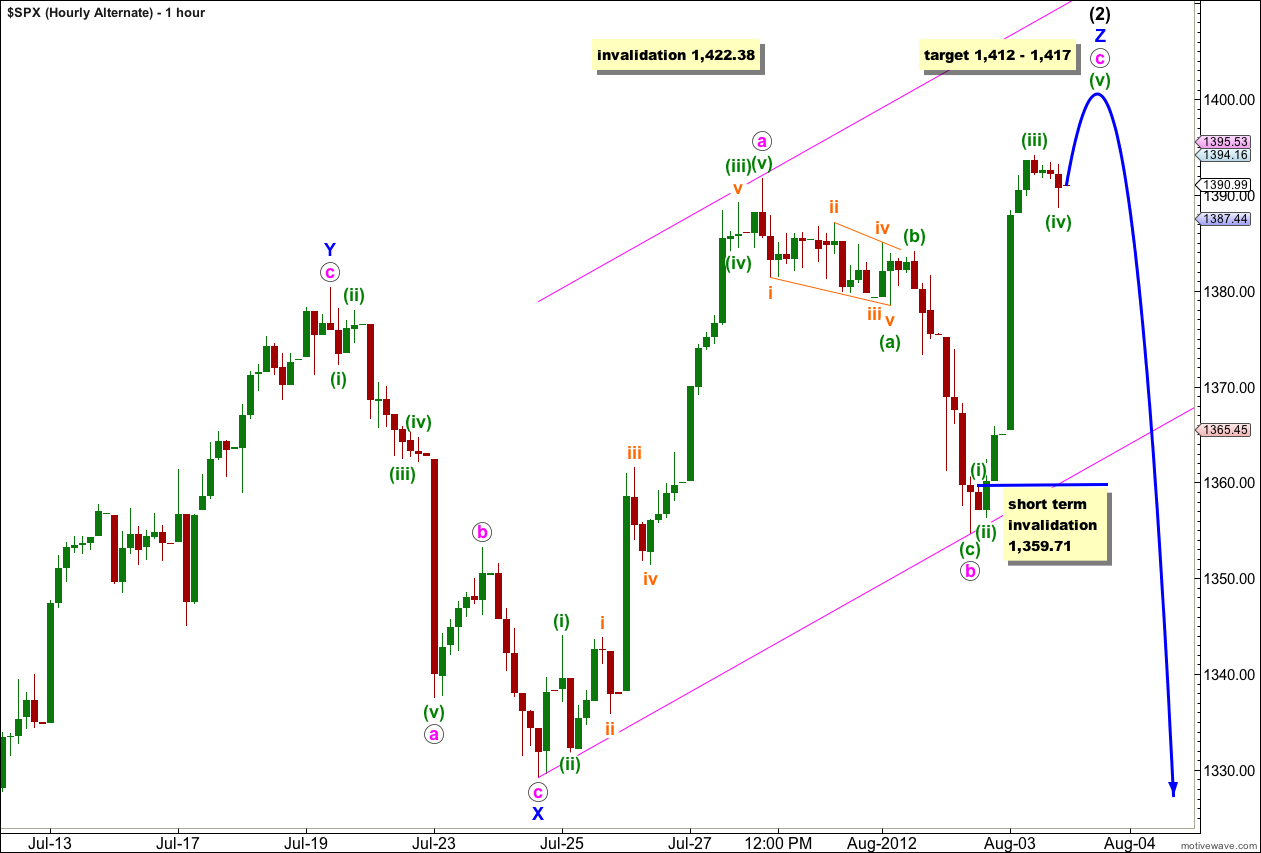
Within wave c pink the structure is incomplete. It needs a final fifth wave upwards to complete it.
At 1,412 wave (v) green would reach 0.618 the length of wave (iii) green.
At 1,417 wave c pink would reach 0.618 the length of wave a pink.
When markets open on Monday then any further downwards movement of wave (iv) green may not move into wave (i) green price territory. This wave count is invalidated with movement below 1,359.71 in the short term.
Lara i dont know if i am being dumb but i cant access the most recent posts – including this – from the home page. Only from the contact or faq page. Have i missed something, or should i bookmark a different “opening” page?
The site was being rearranged during Sunday NY time. It’s all done now. I’ve tried to make it more user friendly for members. Let me know what you think.
Lara, Thank you for the email.
This attached chart shows a lot of bearish divergence building into last Friday’s (higher high). Which just about hit the upper BB line too.
http://scharts.co/OCTNm0 Looking for some type of retrace ES 1393.25 hitting the upper trend line just a few mins ago. Have a buy-limit set for 1366.00 (61.8% Fib).
Yes, there is a lot of divergence, particularly with volume, which really does fit into the alternate wave count better.
Its gotta end soon!