
Yesterday’s analysis expected downwards movement for the main hourly wave count which is what happened. At this stage the alternate wave count remains valid but it looks so ridiculous I will only publish it to point out its errors.
I will be using the parallel channel on the daily chart to confirm a trend change. Prior to a trend channel breach we must accept the possibility that there has been no trend change.
Click on the charts below to enlarge.
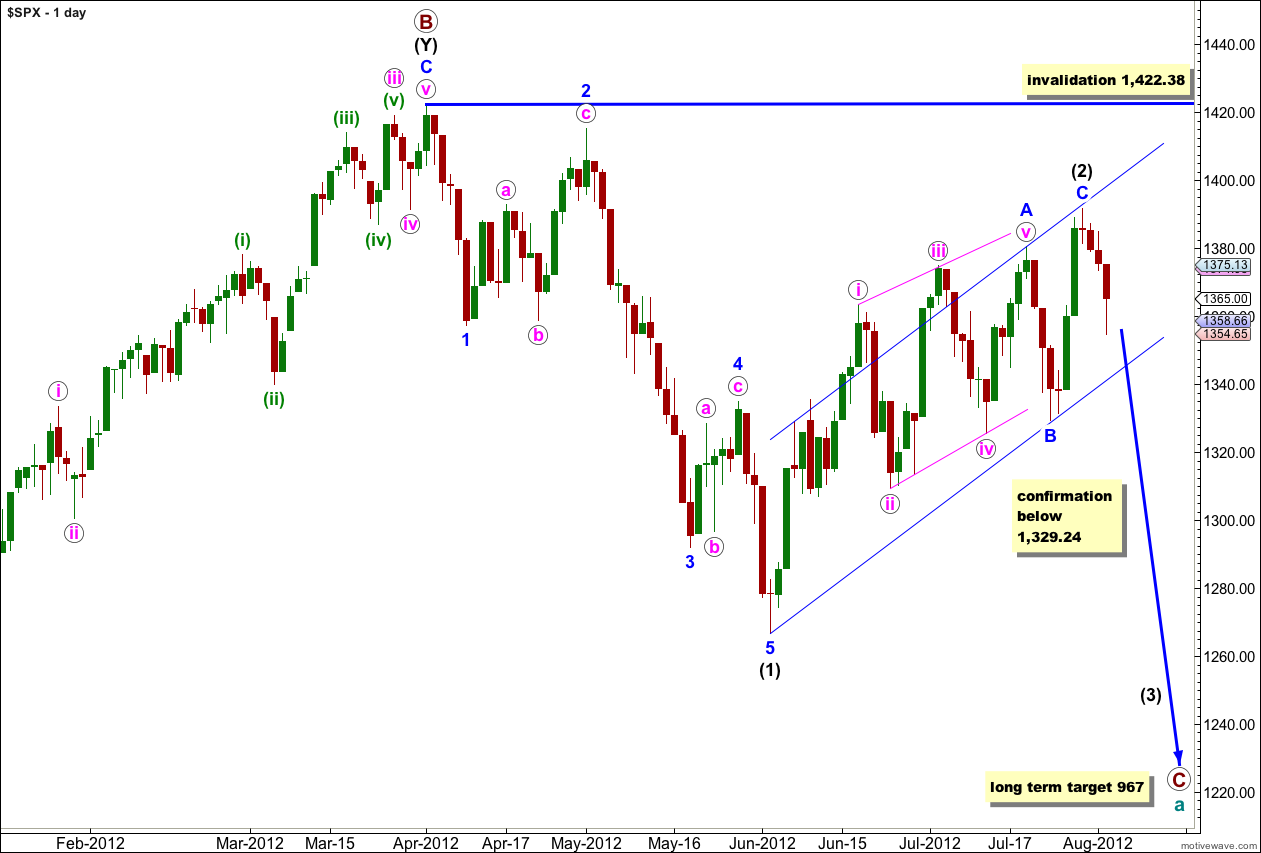
This wave count sees a big trend change at the price high of 1,422.38. Primary wave C should make substantial new lows below the end of primary wave A which had its low at 1,074.77. Primary wave C would reach 1.618 the length of primary wave A at 967, completing a typical expanded flat for cycle wave a.
Within primary wave C wave (1) black is a complete five wave impulse downwards. Wave (2) black is a single zigzag structure. Within wave (2) black wave A blue is a leading contracting diagonal, wave B blue is a sharp zigzag, and wave C blue is a simple impulse. Waves A and C blue have good alternation in structure.
We may use Elliott’s channeling technique to draw a parallel channel about wave (2) black. When this channel is breached by downwards movement we should have confirmation of a trend change. Until we have some confirmation of a trend change we must accept the possibility of new upwards movement.
When wave C blue is confirmed as complete then the only way that wave (2) black could continue further would be as a very rare triple zigzag. The rarity of triples means the probability of wave (2) black continuing further is extremely low. Also, for the S&P 500 to continue further within this correction it would diverge significantly with the Dow. For the Dow the only corrective structure which fits the upwards movement and meets all rules is a triple zigzag, so when this last movement is over the correction cannot continue further.
Wave (2) black may not move beyond the start of wave (1) black. This wave count is invalidated with movement above 1,422.38.
When we have confirmation of a trend change I will move the invalidation point to the end of wave (2) black and calculate a target for wave (3) black.
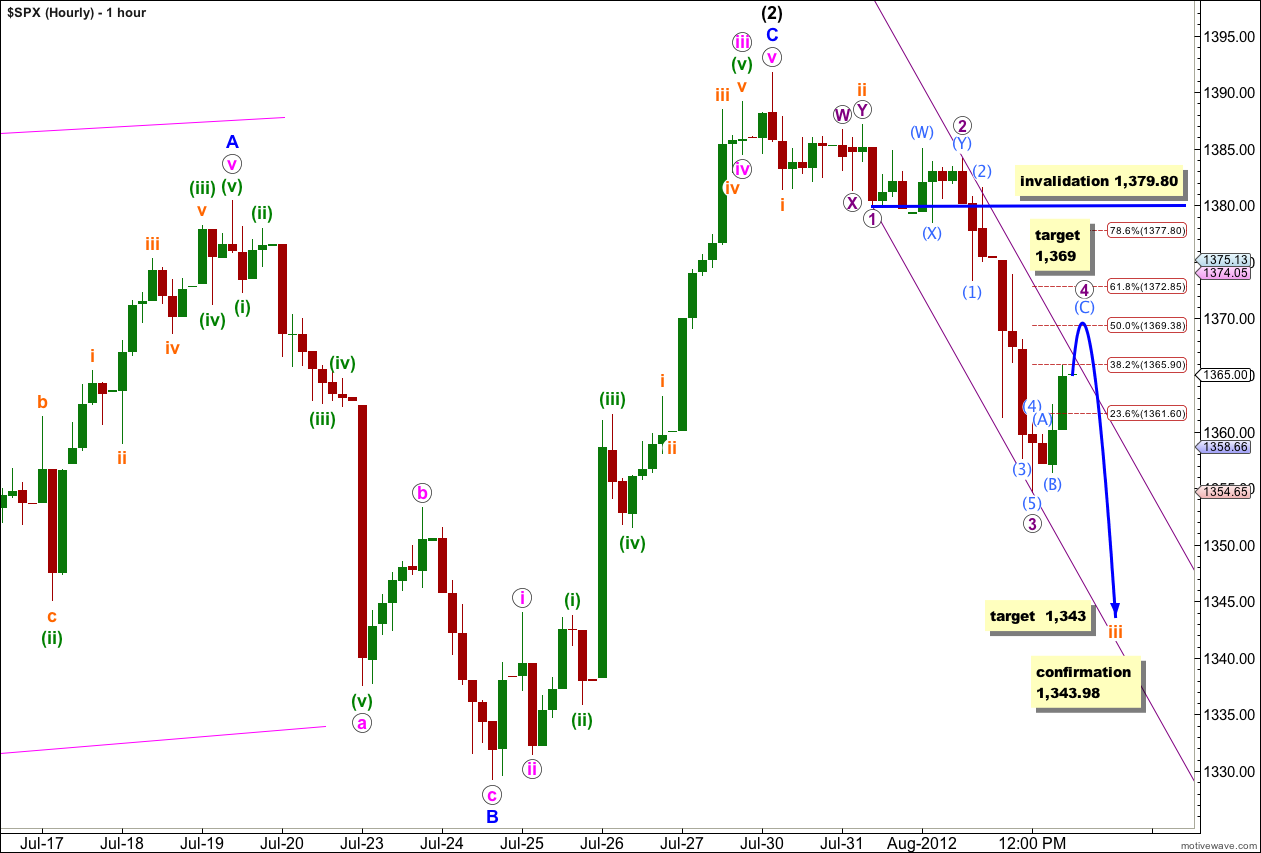
This main wave count has increased in probability today significantly. It is looking increasingly likely that wave (2) black is a complete zigzag and wave (3) black downwards has just begun.
Within new downwards movement the middle of a third wave may have unfolded during Thursday’s session. There is no Fibonacci ratio between waves 3 and 1 purple.
Within wave 4 purple on the 5 and 1 minute charts the structure looks incomplete. It would be highly likely for tomorrow’s session to begin with a little upwards movement. Within wave 4 purple wave (C) aqua would reach 2.618 the length of wave (A) aqua at 1,369. This would bring wave 4 purple to the 50% level of wave 3 purple.
There is good alternation between waves 2 and 4 purple; wave 2 purple is a shallow double combination correction, and wave 4 purple is a deep single zigzag.
Wave 4 purple may not move into wave 1 purple price territory. This wave count is invalidated with movement above 1,379.80.
When wave 4 purple is complete we should expect further downwards movement for wave 5 purple to complete wave iii orange. At 1,343 wave iii orange would reach 4.236 the length of wave i orange.
We may use Elliott’s first channeling technique to draw a parallel channel about downwards movement. Draw the first trend line from the lows of waves 1 to 3 purple, then place a parallel copy upon the high of wave 2 purple. Wave 4 purple may find resistance at the upper edge of this channel.
Sometimes fourth waves are not contained within such a channel. If the target calculated is met this will be the case. If that happens redraw the channel using Elliott’s second technique: draw the first trend line from the highs of waves 2 to 4 purple and then a parallel copy upon the low of wave 3 purple. Expect wave 5 purple downwards to end either midway in the channel or about the lower edge.
Alternate Hourly Wave Count.
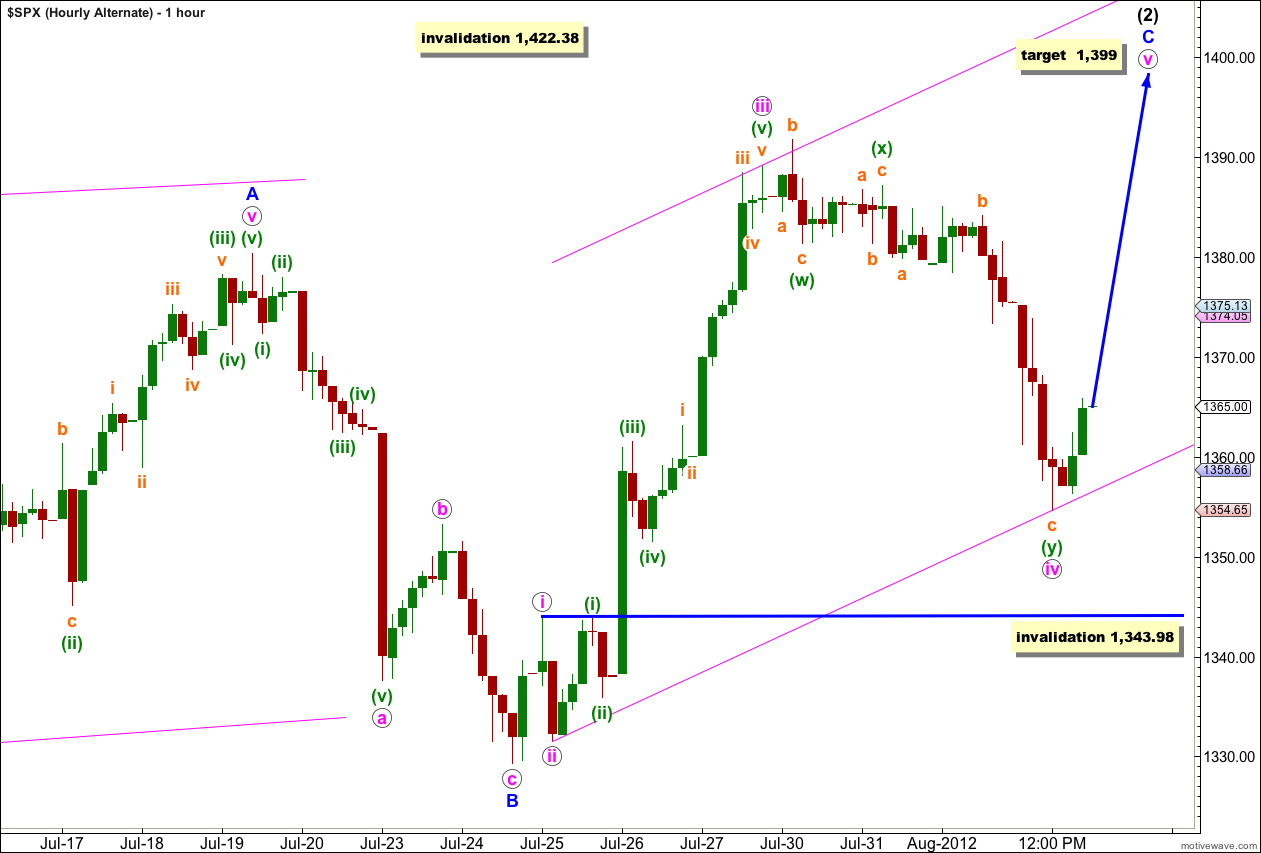
Initially I was not going to publish this wave count again because it looks so wrong. However, I will publish it once again to illustrate what is wrong with it, then I will discard it.
– Wave iv pink is hugely out of proportion now to wave ii pink, so much so that the whole wave count has an entirely wrong look.
– Wave iv pink is labeled as a double combination, the purpose of which is to move price sideways and take up time. However, this one is clearly moving price lower. The purpose is not met.
– Within the second structure of the double for wave iv pink labeled wave (y) green, wave c orange is hugely out of proportion to wave a orange (although there is a 4.236 Fibonacci ratio between them).
– On the daily chart it looks pretty clear that we have had a trend change, at least of a low degree. This movement is difficult to see as a continuation of wave C blue.
– The other possibility I considered was if wave C blue is unfolding as an ending diagonal. However, wave A blue is an ending diagonal and the guideline of alternation tells us that it would be unlikely that wave C blue would have the same structure as wave A blue.
Movement below 1,343.98 would firmly invalidate this wave count and provide us with strong indication of a trend change.
Bullish count it looks like wave (1) of minor 3 of major [3] ended today at 1394 or will need a slightly higher push to 1397, where v = 1.62*i on Monday. I’m expecting a wave (2) of minor 3 retrace of about 50 to 62% retrace ES 1372 to 1366 before wave (3) of minor 3 heads for the 1440.
I think we took out GS stop today at ES 1390.00
Thanks Lara!
John A
You’re welcome John!
Nice to see you back.
This correction has been going on for a whole lot longer than I think any Elliott wave analyst could have reasonably expected. I don’t think any EW analyst would have confidently predicted a triple zigzag either! (that’s the only structure I can see for the Dow which meets all EW rules). So here’s hoping it ends soon.
Look like we will drop to 1364 for Wave 2 … then we go up for a very long wave. HOD 1390.50
Bullish count we have wave minor 2 of maj0r [3] ended today at 1355, just above the 62% retrace target of 1353. Wave minor 3 of major [3] projects at least 102 points higher to a target of 1457, where minor 3 is 1.62*minor 1. Even though the limit of the minor retrace is at 1329, it’s critical that minor 2 held the lower end of the 1363 pivot support at 1356.
“panic” buying will start once again … ES 1374 to 1382
Lara, Two great proposals