
With price moving lower, albeit relatively slowly, I have a new alternate wave count today.
The main hourly wave count remains valid. The daily wave count also remains the same.
Click on the charts below to enlarge.
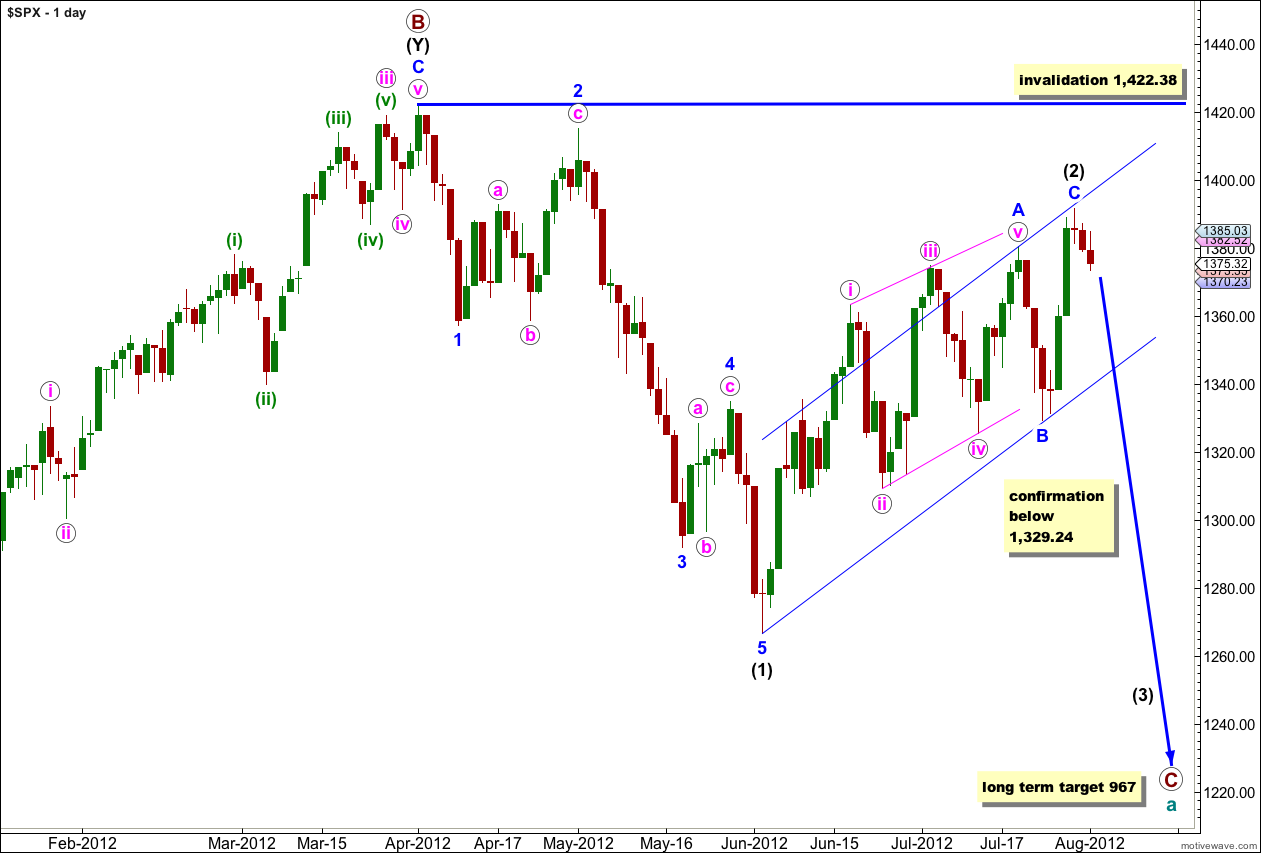
This wave count sees a big trend change at the price high of 1,422.38. Primary wave C should make substantial new lows below the end of primary wave A which had its low at 1,074.77. Primary wave C would reach 1.618 the length of primary wave A at 967, completing a typical expanded flat for cycle wave a.
Within primary wave C wave (1) black is a complete five wave impulse downwards. Wave (2) black is a single zigzag structure. Within wave (2) black wave A blue is a leading contracting diagonal, wave B blue is a sharp zigzag, and wave C blue is a simple impulse. Waves A and C blue have good alternation in structure.
We may use Elliott’s channeling technique to draw a parallel channel about wave (2) black. When this channel is breached by downwards movement we should have confirmation of a trend change. Until we have some confirmation of a trend change we must accept the possibility of new upwards movement.
When wave C blue is confirmed as complete then the only way that wave (2) black could continue further would be as a very rare triple zigzag. The rarity of triples means the probability of wave (2) black continuing further is extremely low. Also, for the S&P 500 to continue further within this correction it would diverge significantly with the Dow. For the Dow the only corrective structure which fits the upwards movement and meets all rules is a triple zigzag, so when this last movement is over the correction cannot continue further.
Wave (2) black may not move beyond the start of wave (1) black. This wave count is invalidated with movement above 1,422.38.
When we have confirmation of a trend change I will move the invalidation point to the end of wave (2) black and calculate a target for wave (3) black.
Main Hourly Wave Count.
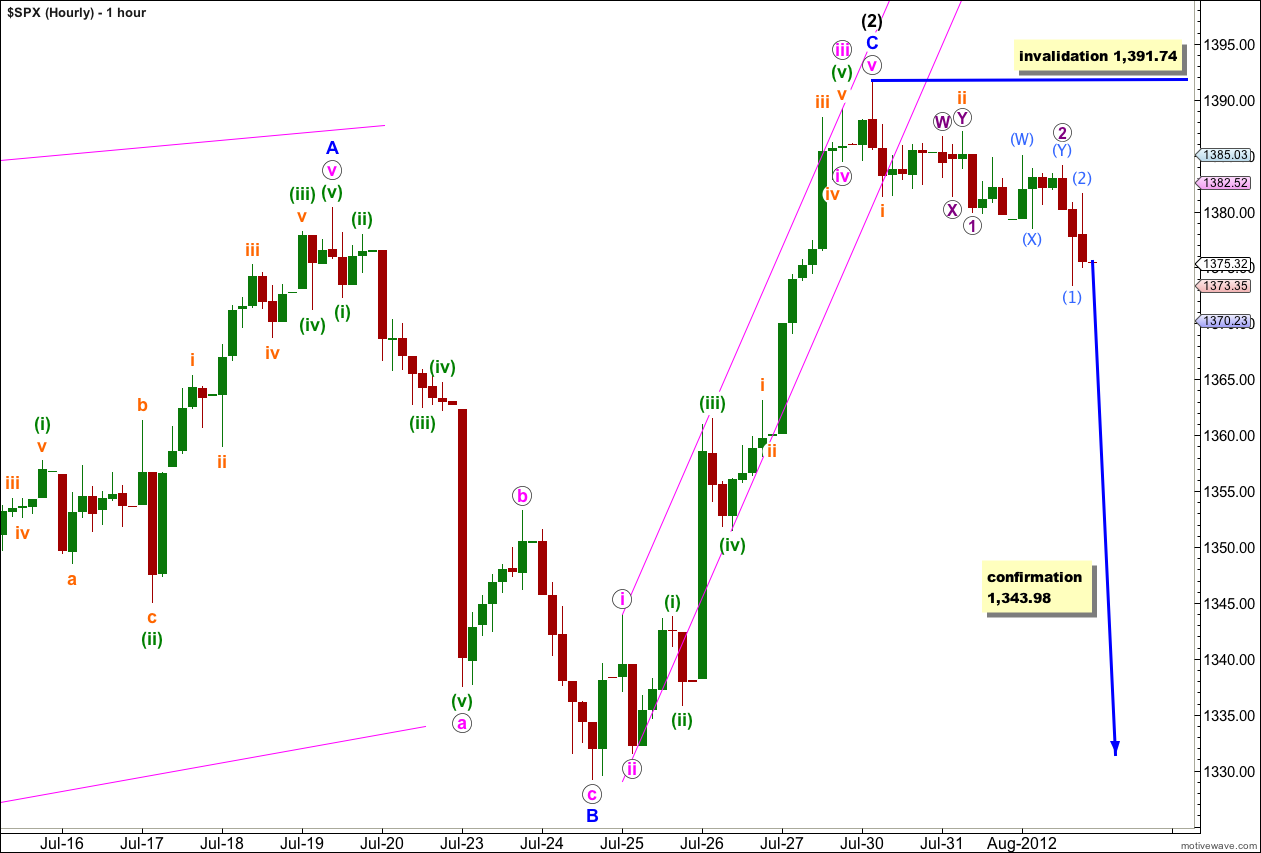
This new hourly wave count has a better fit with recent movement on the 5 minute chart, and for that reason it is now my main wave count.
It is possible that wave iv pink was over as a very brief zigzag and wave v pink a short impulse.
There if no Fibonacci ratio between waves A and C blue.
Ratios within wave C blue are: wave iii pink is 4.75 points short of 4.236 the length of wave i pink, and there is no Fibonacci ratio between wave v pink and either of i or iii pink.
Recent downwards movement subdivides nicely into a series of overlapping first and second waves. If this is correct we may see strong downwards movement tomorrow or the day after as a third wave down gathers momentum.
Within the new downwards trend any second wave correction may not move beyond the start of the first wave. This wave count is invalidated with movement above 1,391.74.
Alternate Hourly Wave Count.
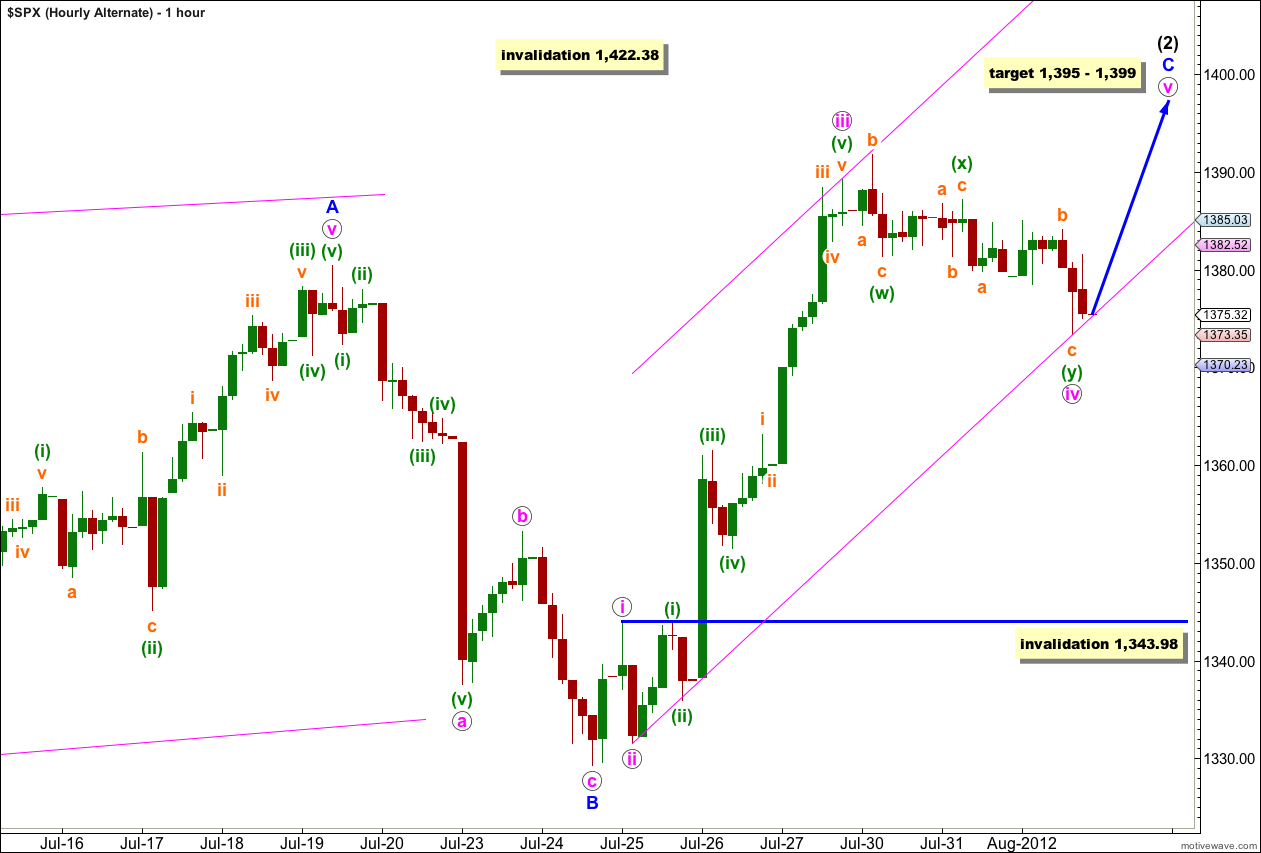
This wave count follows on directly from yesterday’s single hourly wave count. At this stage it is starting to look implausible because wave iv pink is now hugely out of proportion to wave ii pink. However, that does not violate any Elliott wave rules and this wave count remains valid, and must be considered.
Wave iv pink here is a double combination correction: flat – X – zigzag. However, the purpose of a double combination is to move price sideways and take up time. In this case price is clearly moving lower so the normal purpose is not met which reduces the probability that this wave count is correct.
At 1,395 wave v pink would reach 0.382 the length of wave iii pink.
At 1,399 wave C blue would reach 0.618 the length of wave A blue.
This gives us a 4 point target zone for more upwards movement, in one final push. I would favour the lower end of this target zone.
Wave iv pink may not move into wave i pink price territory. This wave count is invalidated with movement below 1,343.98.
Such pressure … 50% retrace ES 1354.50 … and we still could have just a Wave 2 pull back … jobs numbers in the morning could help.
DJT (TRAN) big bounce in the green
1/2 Sell-Limit 1414.25 at this time ES HOD 1377.00
Francis … I am really just looking for about 25 points which should top out our Wave Theory … then later this year go up a lot more 1440 key target.
Karen, I am fine. I know what you are writing about now. Thanks.
Lara, if you think Karen’s count is worth considering, that would mean that your count would be invalidated when it exceeds 1422?
Karen, do you have a pic or your count?
Nope, the invalidation point would remain at 1,422.38.
Instead of C blue being either over or within a fourth wave correction, looking at the main hourly chart move everything within C blue down one degree.
It is possible that only wave i pink within C blue is complete.
C blue may be unfolding as an impulse and this downwards movement may be only wave ii pink.
ii cannot move beyond the start of i so this possibility is invalidated with movement below 1,329.24.
That is why movement below that point is such a strong indicator of a big trend change.
And sweet call not jumping in with both feet bullish a few days ago.
…… sounds good
Thank you.
We are looking at one other count … minor 1 of major [3] ended at 1392 on Monday July 30th and the SPX has been in a bull flag consolidation for minor 2 since then. Minor 2 could very well have ended today at 1373. However, there are lower fib retrace targets are 1368 (38%), 1361 (50%) and 1353 (62%). The 50%/62% retrace target are the most typical of a wave 2. Once minor 2 is complete, the minor 3 target is 1463, bases a minor 2 low of 1361.
That looks at the bullish divergence on the 60min chart.
ah yes, the alternate of moving everything within C blue down one degree and seeing only wave i pink complete with this downwards movement ii pink.
that certainly is possible and that is why the final confirmation point on the daily chart here is at 1,329.24.