
Movement above 1,380.39 was unexpected and has invalidated the wave count.
I have a new wave count which is slightly different. I have just the one hourly chart today.
Click on the charts below to enlarge.
Movement above 1,380.39 has invalidated the prior labeling of wave (2) black as over. Clearly it is continuing higher which was unexpected.
Upwards movement within (2) black is choppy and overlapping, which contrasts with downwards movement of wave (1) black as a clear impulse. So far this upwards movement has a cursory count of 7 which is corrective. Despite strong upwards movement of the last 2 days it still looks most likely that this movement is a second wave correction. Second wave corrections are more likely to be deep. When they are very deep they convince us that we have not seen a trend change, and they do this right before a third wave takes off in the opposite direction. We should keep this tendency in mind.
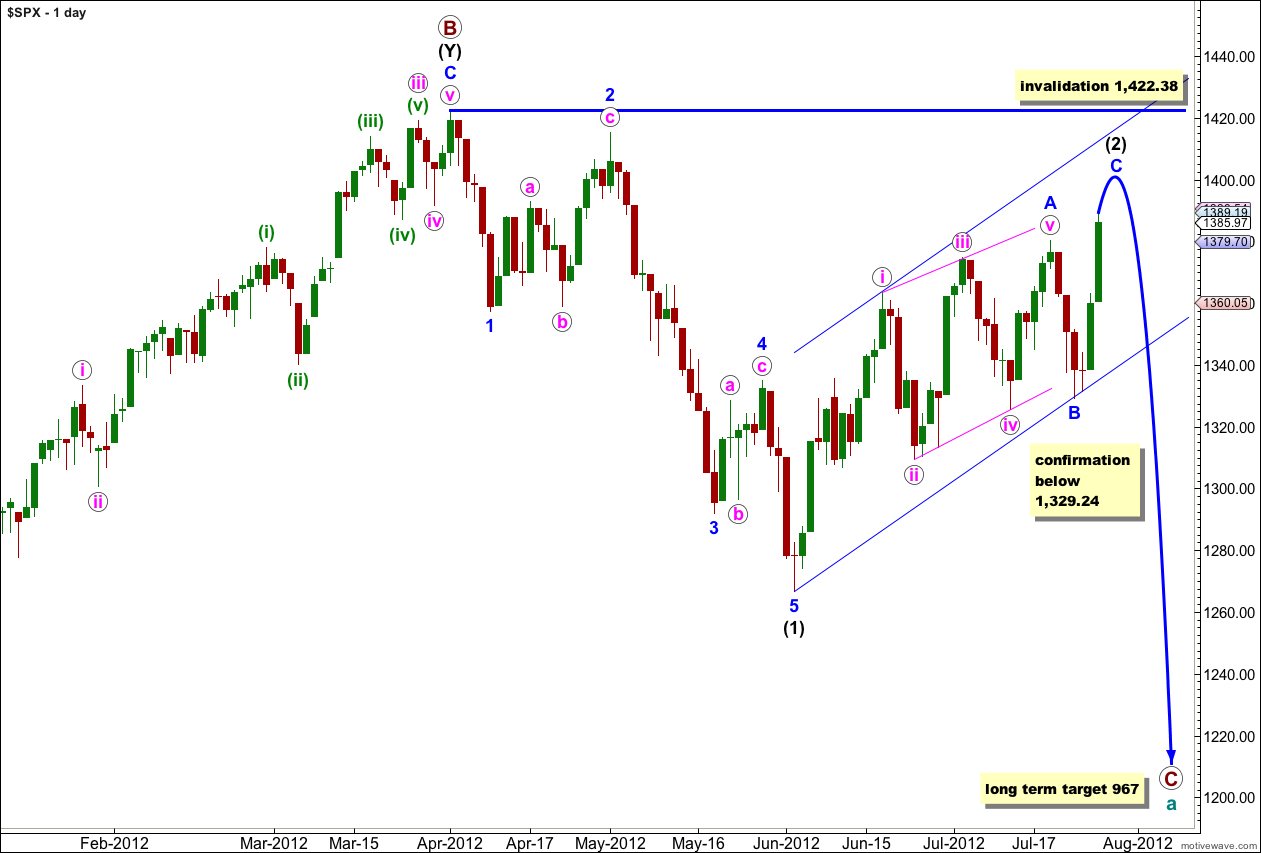
This wave count sees a big trend change at the price high of 1,422.38. Primary wave C should make substantial new lows below the end of primary wave A which had its low at 1,074.77. Primary wave C would reach 1.618 the length of primary wave A at 967, completing a typical expanded flat for cycle wave a.
Within primary wave C wave (1) black is a complete five wave impulse downwards. Wave (2) black may be completing a single zigzag structure. Within wave (2) black wave A blue is a leading contracting diagonal, wave B blue is a sharp zigzag, and wave C blue is a simple impulse. Waves A and C blue have good alternation in structure.
We may use Elliott’s channeling technique to draw a parallel channel about wave (2) black. When this channel is breached by downwards movement we should have confirmation of a trend change.
The only way at this stage that wave (2) black could continue further would be as a very rare triple zigzag. The rarity of triples means the probability of wave (2) black continuing further is extremely low.
Wave (2) black may not move beyond the start of wave (1) black. This wave count is invalidated with movement above 1,422.38.
If price did move above 1,422.38 then the only possible explanation I can see at this stage is a very rare expanding triangle at super cycle degree, as the first alternate monthly wave count here.
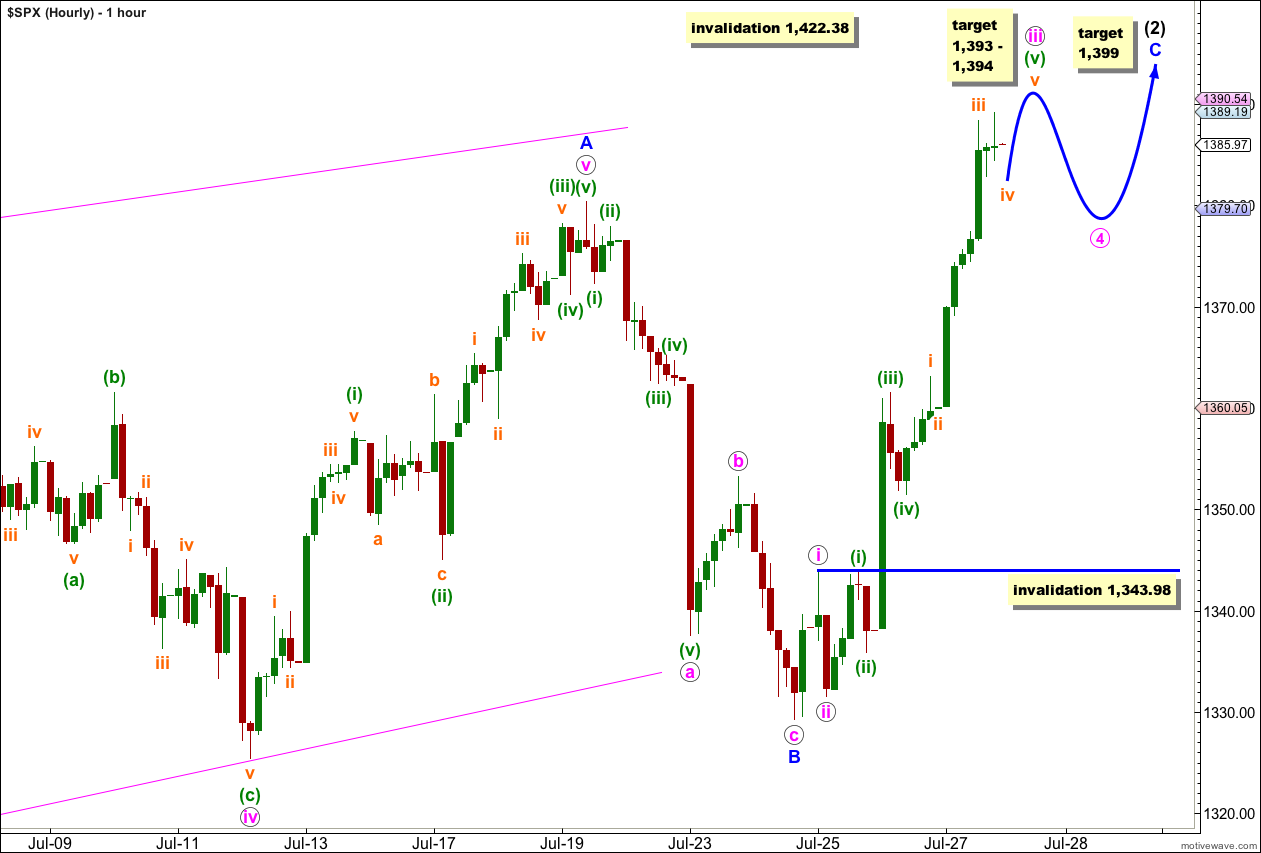
Within wave (2) black wave C blue is incomplete.
When markets open on Monday morning we may see a very little downwards movement for wave iv orange. Thereafter, wave v orange upwards should complete wave iii pink within wave C blue.
At 1,394 wave iii pink would reach 4.236 the length of wave i pink. At 1,394 wave (v) green would reach 1.618 the length of wave (i) green. This gives us a small one point target zone for upwards movement which should be reached during Monday’s session.
Wave iv pink may not move into wave i pink price territory. This wave count is invalidated with movement below 1,343.98 in the short to mid term.
After wave iv pink is complete then further upwards movement should complete wave v pink. This would complete the entire correction of wave (2) black.
At 1,399 wave C blue would reach 0.618 the length of wave A blue. When wave iv pink is complete I will use Fibonacci ratios between pink waves within wave C blue to refine this target and it will probably change.
To the upside the invalidation point is at 1,422.38. Wave (2) black may not move beyond the start of wave (1) black.
I hope to exit the remainder of our position later this week or next (ES 1414.25) “panic rally.”
Wake up , Bill. We’re dealing with probabilities here. By definition we’re all going to be wrong some of the time. Lara’s “right-to-wrong” ratio is just fantastic. You’re unlikely to find anyone to beat it.
Thank you!
I think you all know that when my wave count is invalidated I’m taking it very seriously. My heart sinks and I will spend as long as it takes staring at the chart to find a viable explanation.
It is very frustrating to see a good wave count invalidated and then to see a new wave count and ask yourself “why didn’t I see that yesterday?”
I’m always learning and trying to improve.
With this unusually strong wave 3 thrust we could have a truncated fifth this week too. http://thepatternsite.com/EWTruncation.html
My 1st target has been 1434.44 using Wave Theory, but we still trade like a pig up and down the minors waves (with Lara’s help) with the final target hitting 1500’s .
We have to keep in mind that NO wave count is set in stone it is just a proposal and you MUST use your own lower indicators to validate the count (it has helped me for the last 20 years).
How do I count on you when you KEEP changing???
if you cannot accept change then think of what you are asking me to do.
you are expecting me to know what is the correct wave count at the beginning of each movement, among a wide variety of alternates.
that is simply impossible and unrealistic.