
Yesterday’s analysis of the S&P 500 had two hourly wave counts with about an even probability. Movement above 1,343.77 invalidated the main hourly wave count and confirmed the alternate. At that stage the preferred target for upwards movement was about 1,360.85. Price reached up to 1,363.13 during Thursday’s session.
Today I have again two hourly wave counts for you, but today the main wave count has a higher probability than the alternate.
Click on the charts below to enlarge.
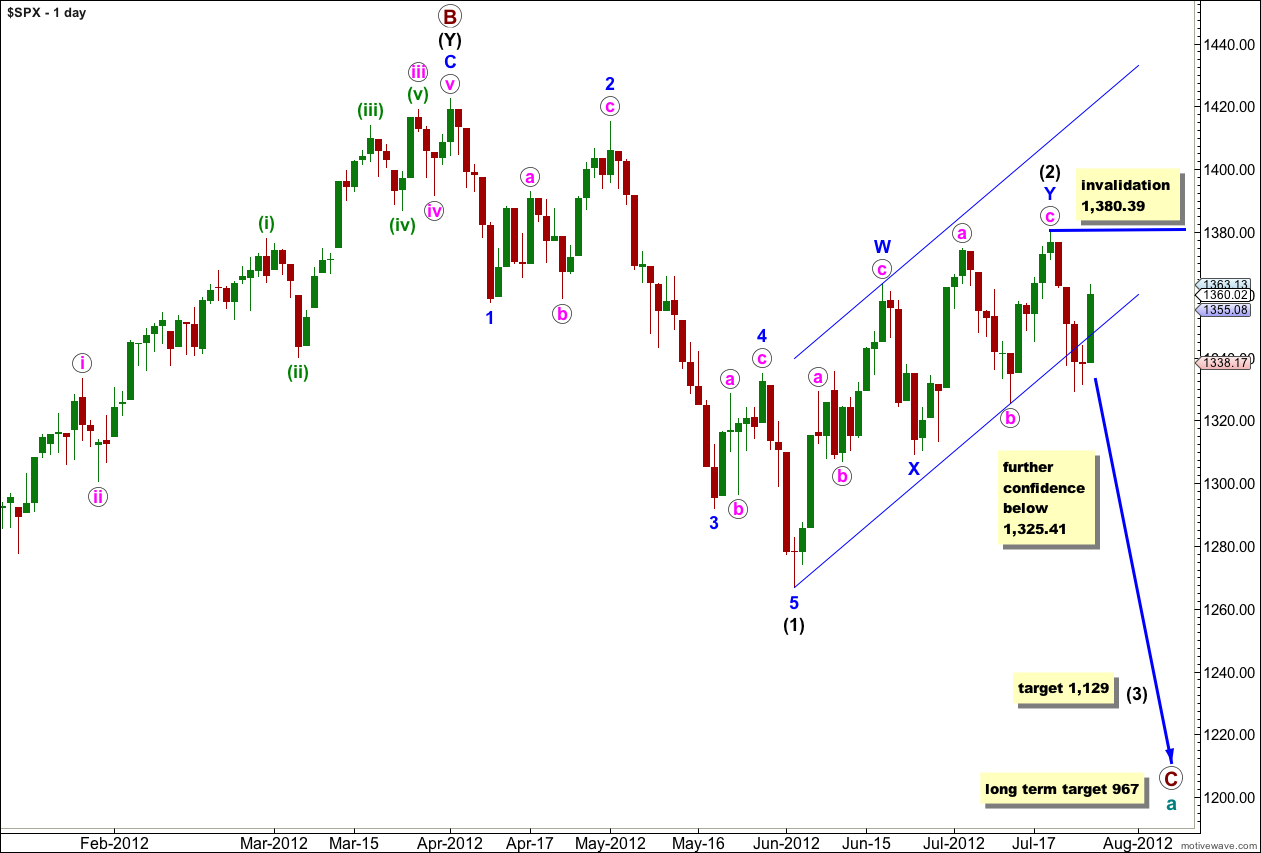
This wave count sees a big trend change at the price high of 1,422.38. Primary wave C should make substantial new lows below the end of primary wave A which had its low at 1,074.77. Primary wave C would reach 1.618 the length of primary wave A at 967, completing a typical expanded flat for cycle wave a.
Within primary wave C wave (1) black is a complete five wave impulse downwards. Wave (2) black now is most likely complete as a double zigzag structure.
The parallel channel about wave (2) black is a best fit to contain all this upwards movement. We now have a clear channel breach with a full daily candlestick below the channel. This gives some confirmation that (2) black should be over and (3) black should be underway.
The only way at this stage that wave (2) black could continue further would be as a very rare triple zigzag. The rarity of triples means the probability of wave (2) black continuing further is extremely low.
Movement below 1,325.41 would provide a lot more confidence in this wave count. At that stage wave c pink of Y blue could not possibly be continuing further and so the entire correction for wave (2) black would have to be over.
At 1,129 wave (3) black would reach 1.618 the length of wave (1) black.
Within wave (3) black no second wave correction may move beyond the start of its first wave. This wave count is invalidated with movement above 1,380.39.
Main Hourly Wave Count.

This wave count has an excellent look and fit. Instead of the slightly truncated C wave I had labeled for yesterday’s analysis, that was only wave 1 within the C wave. Wave (ii) green may be almost complete as a typical zigzag ending typically a little above the 0.618 Fibonacci ratio of wave (i) green downwards.
There is not enough downwards movement at the end of Thursday’s session to confirm that wave 5 purple within wave c orange is over, and on the 5 minute chart it looks most likely that wave 5 purple requires a final fifth wave upwards to complete the structure.
Within wave c orange wave 3 purple has no Fibonacci ratio to wave 1 purple. At 1,364 wave 5 purple would be equal in length with wave 1 purple.
We may use Elliott’s channeling technique to draw a parallel channel about the zigzag of wave (ii) green. When this channel is breached by downwards movement then we shall have confirmation that the upwards zigzag is over and the next move down is underway. It is most likely that this next move is a third wave.
Because the channel drawn about the zigzag is so far away we could also use the channel about wave c orange within wave (ii) green. This smaller channel is drawn first from the lows of waves 2 to 4 purple then a parallel copy is placed upon the high of wave 3 purple. I have nudged the lower trend line down to contain all of this movement. If thus channel is breached tomorrow then this would be an early indication of a possible end to wave (ii) green and the start of wave (iii) green downwards.
If price moves below 1,343.98 (the high of wave a orange) tomorrow then we can be sure that the upwards movement is definitely a three wave structure which is over, because at that stage downwards movement may not be a fourth wave correction in a continuing new impulse upwards.
When I know where wave (ii) green has ended then I can calculate a target for wave (iii) green for you. At this stage expect wave (iii) green to be about 83 points in length.
Further upwards movement to begin tomorrow’s session may not move beyond the start of wave (i) green. This wave count is invalidated with movement above 1,380.39.
Alternate Hourly Wave Count.
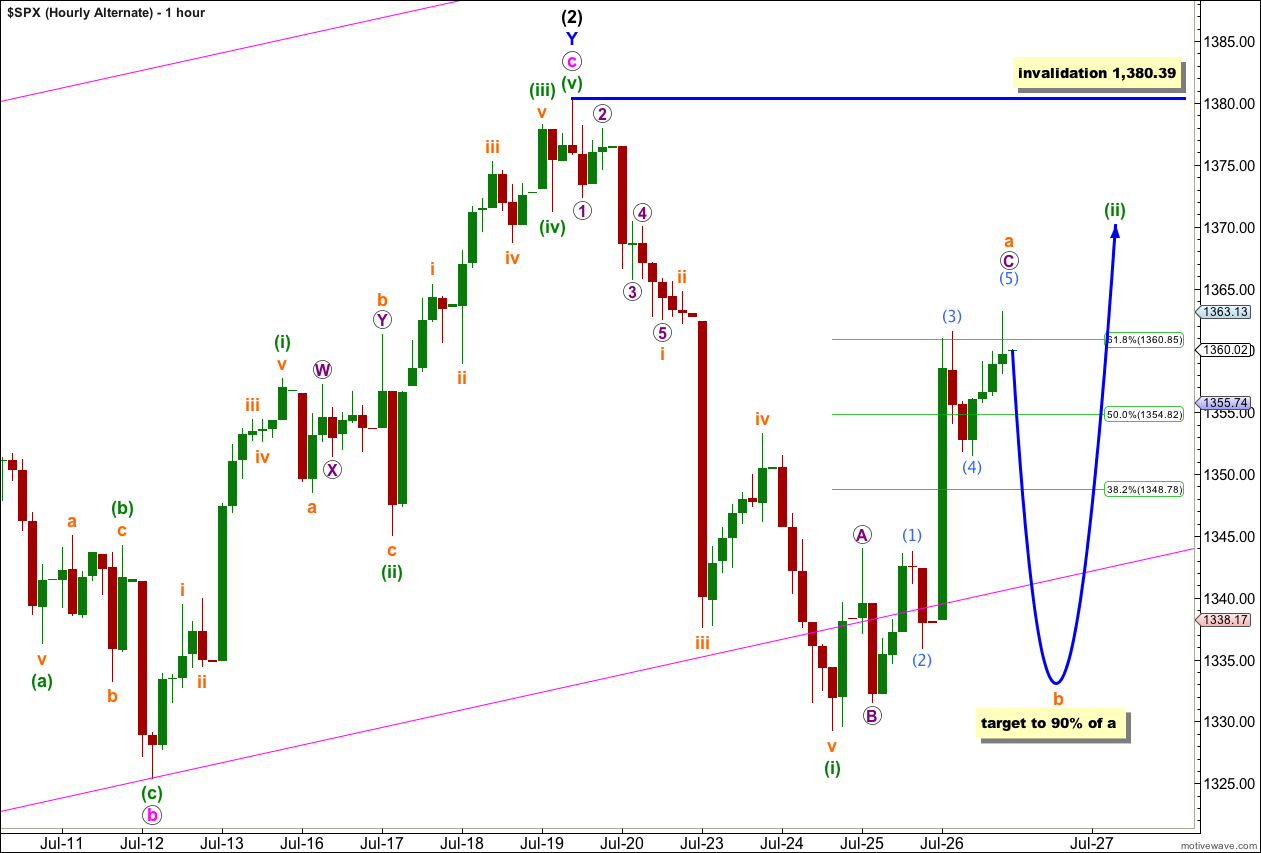
If we simply move the degree of labeling within wave (ii) green down one degree we see that only wave a orange may be almost complete if wave (ii) green may be unfolding as a flat correction.
A flat correction requires the A wave to subdivide into a three and the B wave to reach at least 90% of wave A.
We must look at the downwards structure carefully. If it is choppy and overlapping, if it looks corrective and subdivides into a three, then this alternate may be correct. If it is strong and impulsive subdividing into a five then the main hourly wave count would be correct.
This alternate also must encompass the idea of a double combination unfolding for wave (ii) green (with the depth achieved so far a double zigzag would be unlikely). If this is the case then wave X downwards would most likely be a zigzag but does not have to reach 90% the length of the first zigzag upwards.
This wave count has a lower probability than the main wave count today because it sees wave (ii) green as a slightly less likely flat correction (less likely than a zigzag in a second wave position) and it sees wave (ii) green as continuing longer in duration than wave (i) green downwards when second waves are more commonly brief.
Wave (ii) green may not move beyond the start of wave (i) green. This wave count is invalidated with movement above 1,380.39.
Daily closed outside the upper BB the last time that happened was July 3rd, after which we dropped 55 pts.
And on the other hand % of stocks above MA(50) is 75 now and 4/3 is was under 75 when we traded at 1422.38 (closed 1385.97) = bullish divergence
Lara …. new .pdf in the mail
We have to keep in mind we all thought the same on 4/25 with the big powerful moves which just fell back on our heads after a few days.
I think it was the same time the Dow was making new highs too.
Lara,
Today’s rally is extremely powerful, and your daily wave count has been invalidated. It seems like something else is going on here. These moves the past few days just seem too powerful if we have, in fact, had a major trend change.
Peter
I have a wave count which has an excellent fit which I will publish this weekend.
However, looking at the overall upwards movement since 4th June it is extremely choppy and overlapping. Compare it to prior downwards movement which is clearly impulsive.
I agree with Karen; we all thought the same on 25th April.
This is what second waves do. They convince us we have not had a trend change, and they do it right before a third wave in the opposite direction takes off.
Looks like a Wave Five Extension right on the button ES 1371.50 to END Wave (1) short pull back to find (1352 to 1346) Wave (2) bottom next week.
Sent you a pdf file and I think the next Fed meeting is 8/1