
Last analysis of the S&P 500 expected a final push upwards before a trend change. Movement below 1,354.3 invalidated the hourly wave count and indicated a possible trend change may have come earlier than expected. I will use parallel channels on the hourly and daily charts to confirm a trend change.
I still have just the one daily chart and one hourly chart today.
Click on the charts below to enlarge.
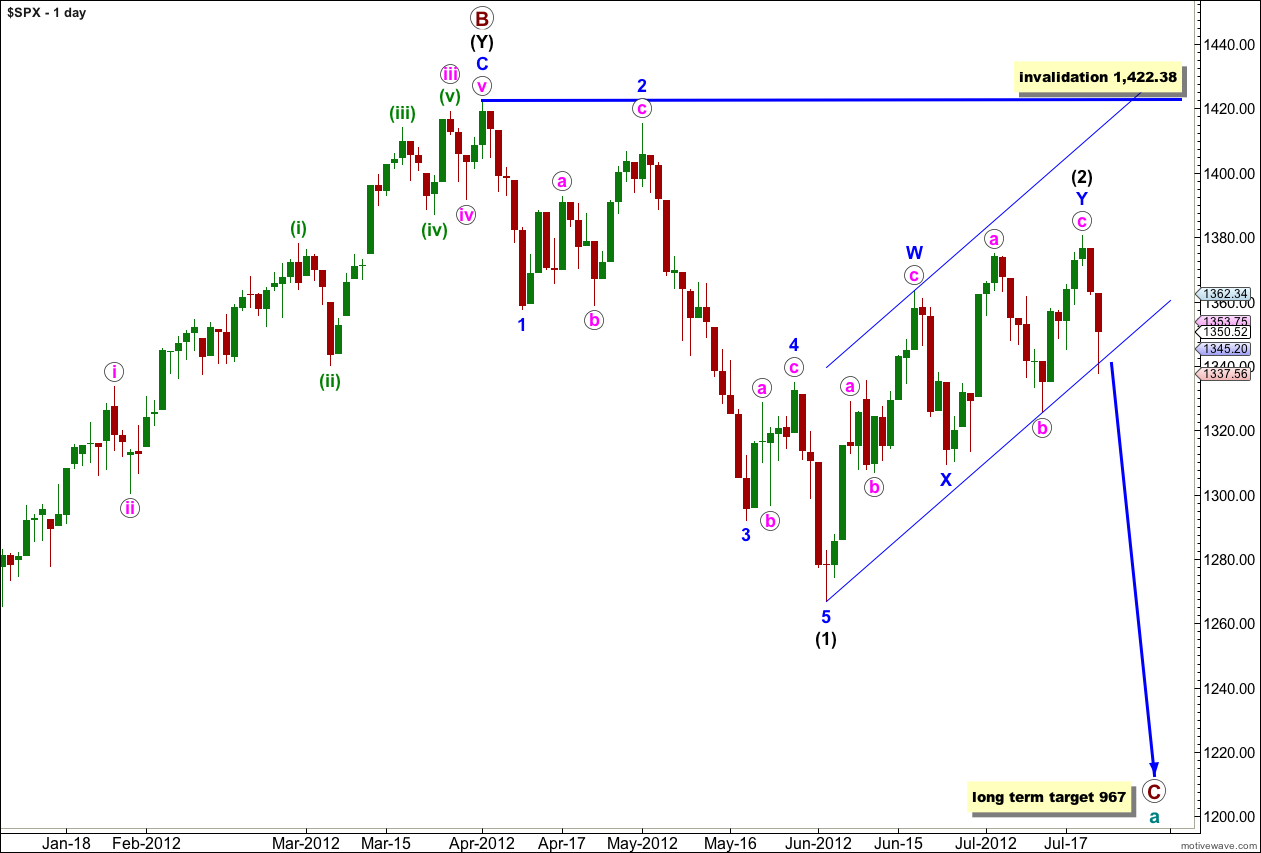
This wave count sees a big trend change at the price high of 1,422.38. Primary wave C should make substantial new lows below the end of primary wave A which had its low at 1,074.77. Primary wave C would reach 1.618 the length of primary wave A at 967, completing a typical expanded flat for cycle wave a.
Within primary wave C wave (1) black is a complete five wave impulse downwards. Wave (2) black is unfolding as a double zigzag structure. The purpose of a double zigzag is to deepen a correction. At this stage the final structure of wave Y blue, the second zigzag, is still incomplete and may yet take a few more days to unfold.
The parallel channel about wave (2) black is a best fit to contain all this upwards movement. When we have a clear channel breach with a full daily candlestick below the channel then we may have confirmation that (2) black would be over and (3) black would be underway.
Wave (2) black may not move beyond the start of wave (1) black. This wave count is invalidated with movement above 1,422.38.
Last analysis expected upwards movement to start the new trading week. Within the first 5 minutes however that wave count was invalidated indicating a possible end to wave (2) black had already occurred.
On the 5 minute chart wave (v) green within wave c pink upwards does subdivide nicely into a five wave impulse. Ratios within wave c pink are: wave (iii) green is just 0.73 points longer than equality with wave (i) green, and wave (v) green has no Fibonacci ratio to either of waves (i) or (iii) green.
There is no Fibonacci ratio between waves a and c pink within the zigzag of wave Y blue.
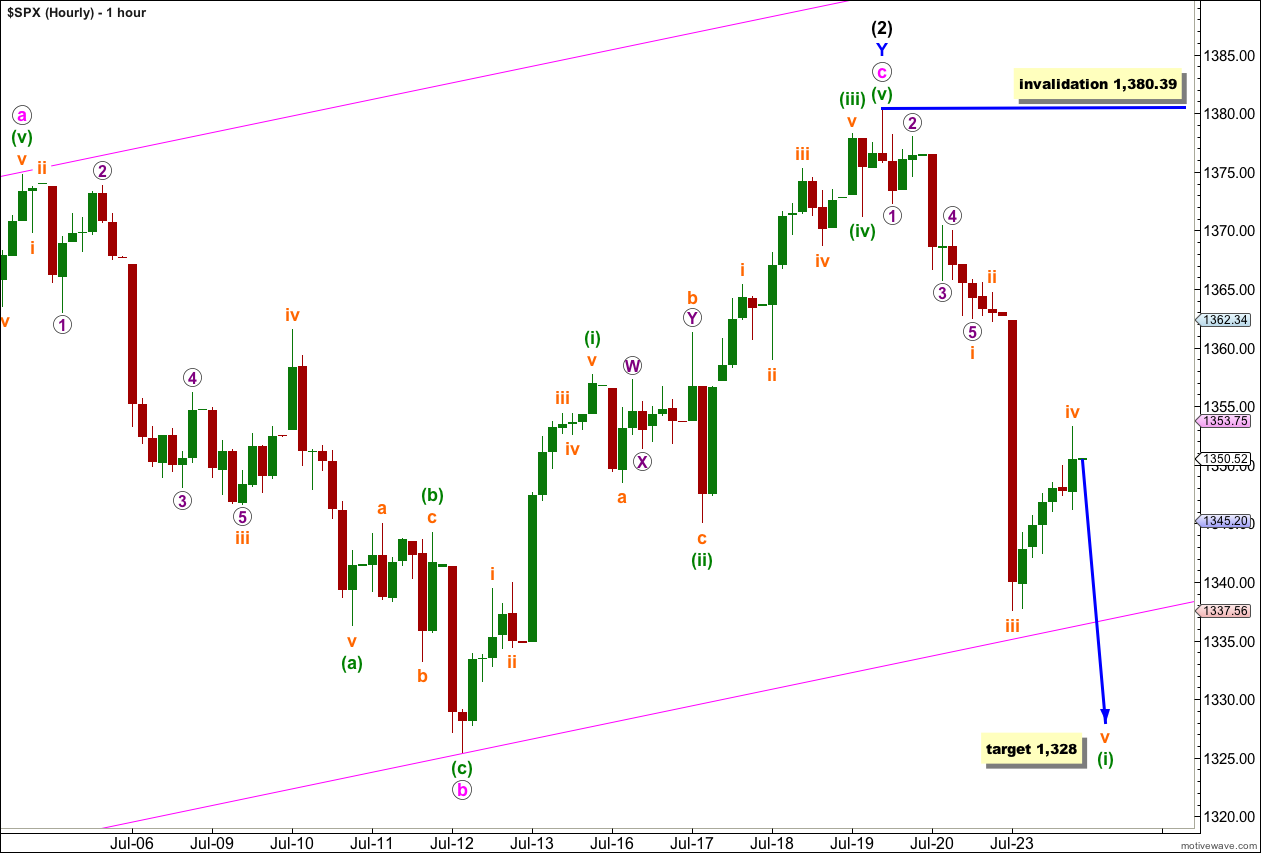
Downwards movement during Monday’s session looks very much like a strong third wave. So far we have a three down and upwards movement at the end of Monday’s session looks like a completed zigzag for a fourth wave.
Wave iii orange is 2.02 points short of 1.618 the length of wave i orange.
Wave ii orange subdivides on the 5 minute chart best as a double combination. Wave iv orange subdivides best as a zigzag. Wave ii orange was a very shallow correction and wave iv orange is a very deep correction. There is perfect alternation between these two corrections.
This wave count requires a fifth wave downwards tomorrow in order for us to have more confidence in it. Once we can see a clear five down on the hourly chart we may have some confidence in a trend change.
At 1,328 wave v orange would reach 0.618 the length of wave iii orange.
Movement below the parallel channel on the hourly chart would provide further confidence in a trend change, and movement below the parallel channel on the daily chart would provide enough confidence for me to calculate a mid to long term target for wave (3) black. Prior to trend channel confirmation we must accept the possibility that there has been no trend change.
Wave (ii) green to follow the end of wave (i) green may not move beyond the start of wave (i) green. This wave count is invalidated with movement above 1,380.39.
We do have a hidden bullish divergence (from the previous low on July 12th) within NYMO which gives weight that today could have ended Wave (2) and Wave (3) has started which targets 1426.00. http://stockcharts.com/h-sc/ui?s=$NYMO&p=D&yr=0&mn=9&dy=0&id=p53358940404
What do you think ??
Yes, it is possible. Particularly while the downwards movement may be counted as a three.
That is why I really want to wait for confirmation of this trend change before having any confidence in it.
However, any wave count that I have so far considered which sees new highs just looks all wrong. That’s why I’ve not published an alternate. If I see something which has a reasonable look then I’ll publish it.
NYMO at -28.44 lower than July 12th.
SPX at 1350.52 higher than July 12th.
Bullish divergence? How so?
It is still a bearish divergence,NYMO at lower levels.