
Last analysis expected Friday’s session to begin with at least a little downwards movement. A possible contracting triangle was invalidated with movement below 1,372.33 and at that stage I expected downwards movement to end a little below 1,368.7 and to last at least one to two sessions.
Price reached down to 1,362.19 which remains within the allowable limits for the wave count and is just a little below where I expected it to reach.
I still have just one daily and one hourly wave count to end the trading week.
Click on the charts below to enlarge.
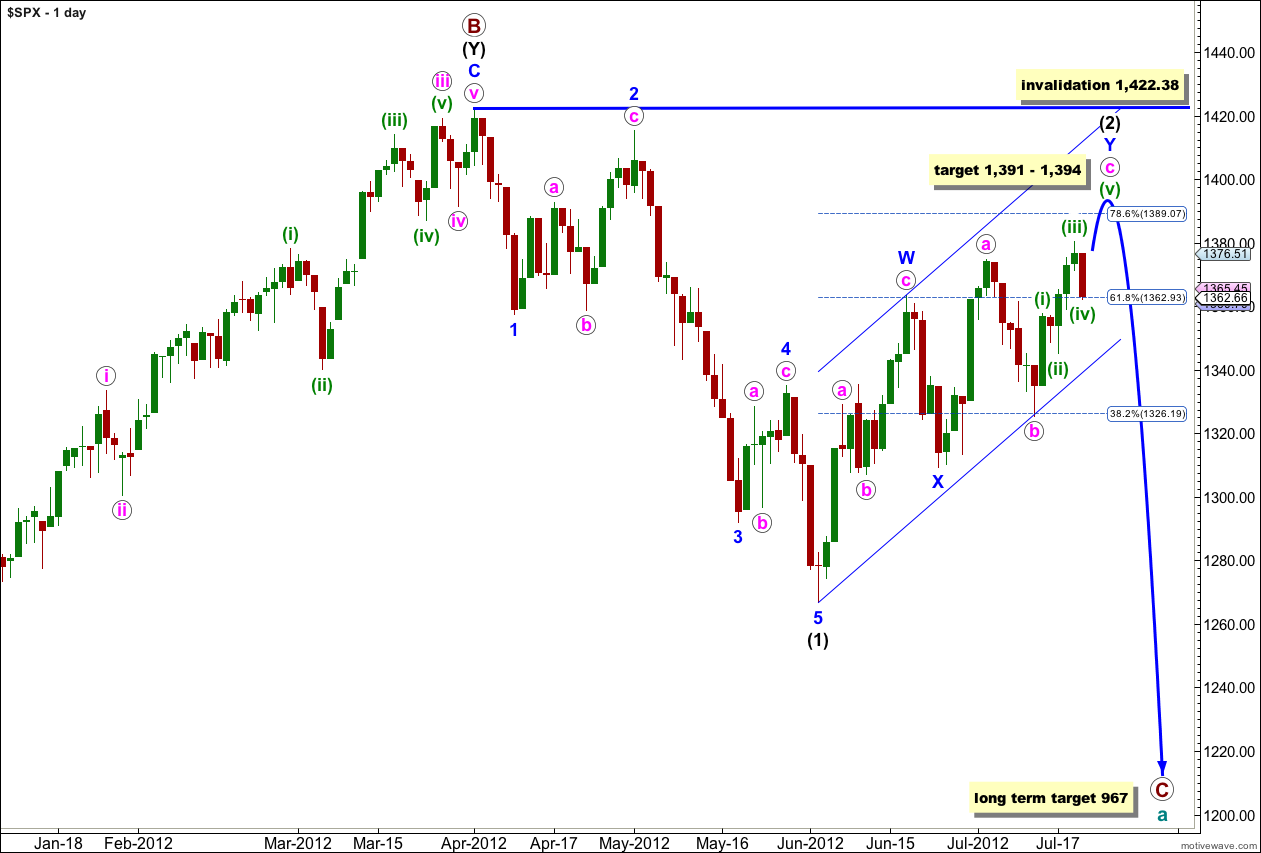
This wave count sees a big trend change at the price high of 1,422.38. Primary wave C should make substantial new lows below the end of primary wave A which had its low at 1,074.77. Primary wave C would reach 1.618 the length of primary wave A at 967, completing a typical expanded flat for cycle wave a.
Within primary wave C wave (1) black is a complete five wave impulse downwards. Wave (2) black is unfolding as a double zigzag structure. The purpose of a double zigzag is to deepen a correction. At this stage the final structure of wave Y blue, the second zigzag, is still incomplete and may yet take a few more days to unfold.
The parallel channel about wave (2) black is a best fit to contain all this upwards movement. When we have a clear channel breach with a full daily candlestick below the channel then we may have confirmation that (2) black would be over and (3) black would be underway.
Wave (2) black may not move beyond the start of wave (1) black. This wave count is invalidated with movement above 1,422.38.
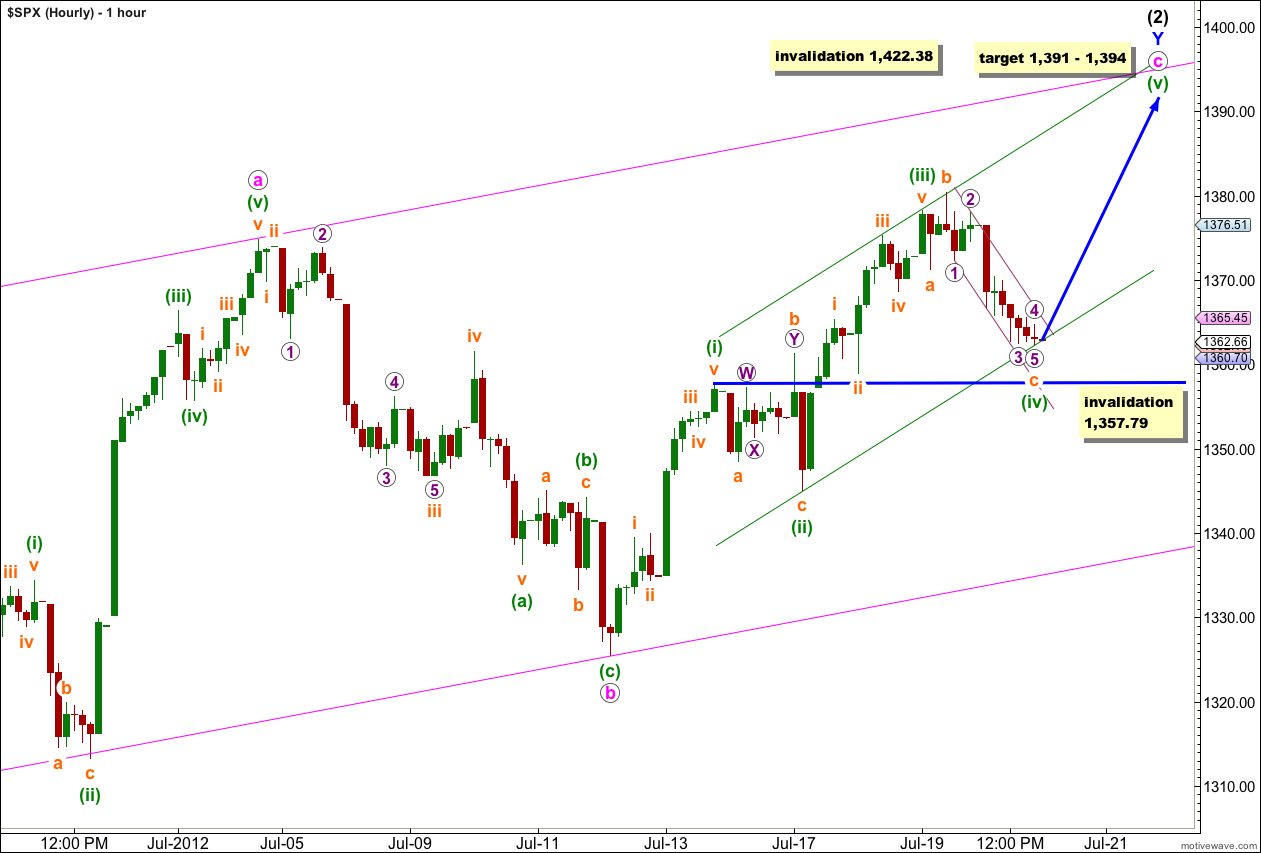
Downwards movement has breached the parallel channel drawn using Elliott’s first channeling technique drawn on the last analysis hourly chart. When the channel does not contain the fourth wave we redraw the channel using Elliott’s second technique. Draw the first trend line from the low of wave (iv) green to the low of wave (ii) green and then place a parallel copy upon the high of wave (iii) green.
Wave (v) green may end most likely mid way within this channel, or less likely about the upper edge of this channel.
When the channel is breached by subsequent downwards movement then we shall have the very first indication that wave (2) black may be over and wave (3) black would be underway. A channel breach of the wider pink channel here on the hourly chart would provide a higher level of confidence in a trend change, and a channel breach on the daily chart would provide final confirmation.
Wave (ii) green was an expanded flat correction. Wave b orange was a 139% correction of wave a orange and wave c orange is 1.38 points longer than 1.618 the length of wave a orange.
Wave (iv) green also looks most like an expanded flat correction. Wave b orange is a 133% correction of wave a orange and wave c orange is just 0.19 points longer than 2.618 the length of wave a orange. Although there is no alternation in the type of structure between wave (ii) and (iv) green there is alternation between the two in the length of the c wave.
When markets open on Monday wave (iv) green may not move into wave (i) green price territory. This wave count is invalidated with movement below 1,357.79.
At 1,394 wave (v) green would reach equality in length with wave (i) green. At 1,391 wave c pink would reach equality in length with wave a pink. This gives us a high probability 3 point target zone. This target may be about one to two sessions away.
If this wave count is invalidated with downwards movement on Monday (before wave (v) green is complete) then the most likely explanation would be that we have seen a trend change and wave (2) black may be complete. I would want to wait for some trend channel confirmation before having confidence in a trend change.
Now, I hope we can make new 52 week highs (expanding triangle)