
Last analysis of the S&P 500 had two hourly wave counts which diverged and price was very close to the confirmation / invalidation point. With price movement above 1,374.81 the main hourly wave count was invalidated and the alternate hourly wave count was confirmed. We have greater clarity now with only one hourly wave count today.
The daily wave count is unchanged.
Click on the charts below to enlarge.
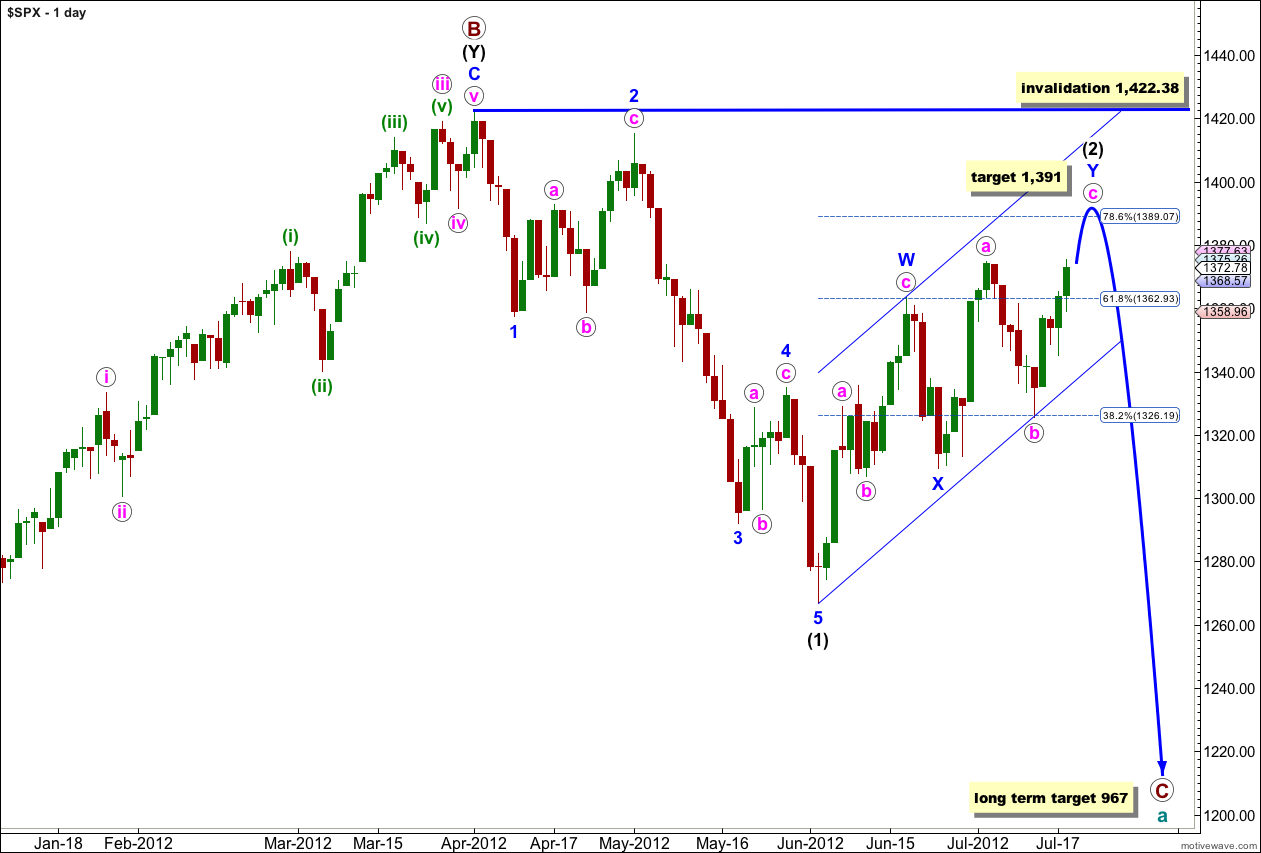
Wave (2) black is not over and we may expect price to rise higher over the next week or so before a trend change.
This wave count sees a big trend change at the price high of 1,422.38. Primary wave C should make substantial new lows below the end of primary wave A which had its low at 1,074.77. Primary wave C would reach 1.618 the length of primary wave A at 967, completing a typical expanded flat for cycle wave a.
Within primary wave C wave (1) black is a complete five wave impulse downwards. Wave (2) black is unfolding as a double zigzag structure. The purpose of a double zigzag is to deepen a correction. At this stage the final structure of wave Y blue, the second zigzag, is still incomplete and may yet take about a week or so to unfold.
Movement above 1,374.81 giving us invalidation of the main hourly wave count and confirmation of the alternate illustrates why it is important to wait for some confirmation of trend changes. In this instance we did not have confirmation that (2) black was over over the last week or so, and it turns out that it was not.
I have redrawn the parallel channel about wave (2) black as a best fit to contain all this upwards movement. When we have a clear channel breach with a full daily candlestick below the channel then we may have confirmation that (2) black would be over and (3) black would be underway. Until we have that confirmation we shall expect new highs.
Wave (2) black may not move beyond the start of wave (1) black. This wave count is invalidated with movement above 1,422.38.
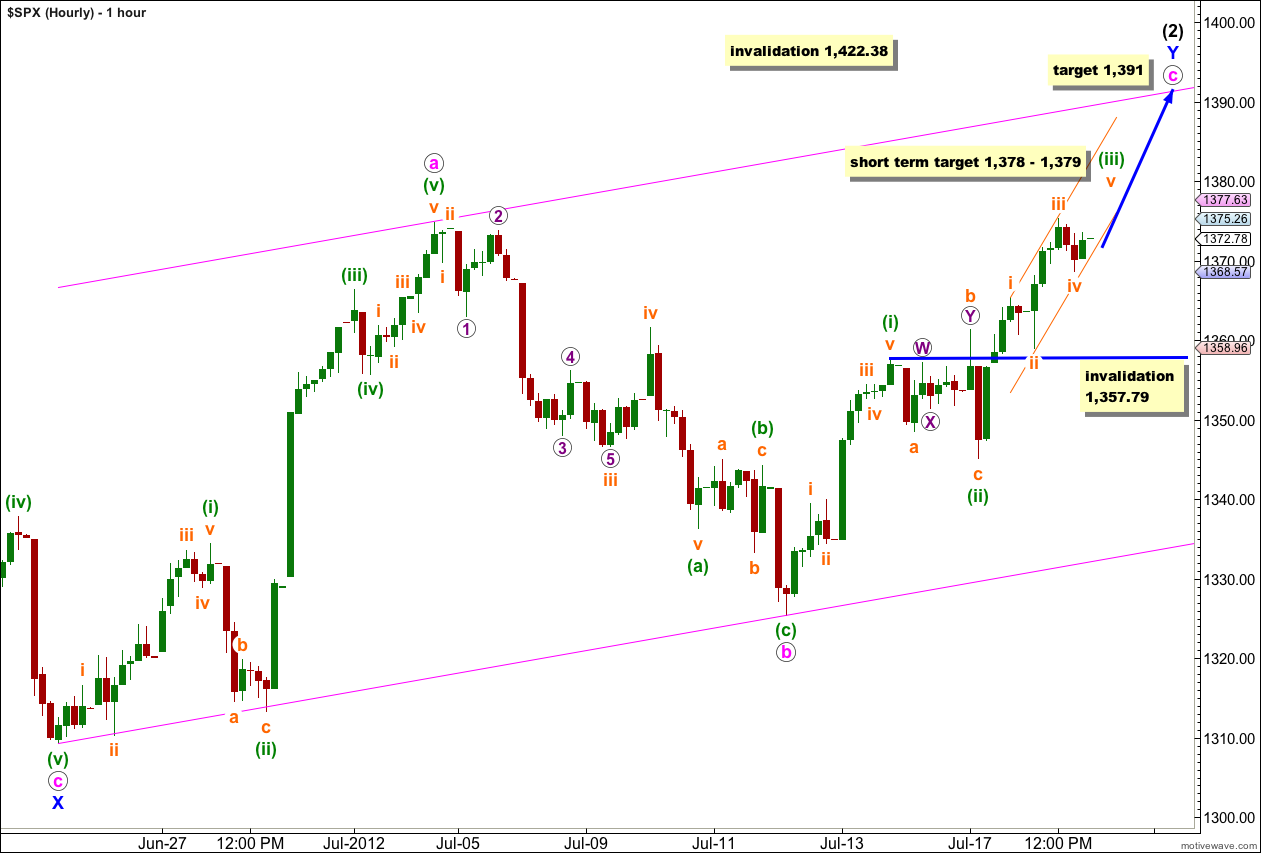
This was yesterday’s alternate hourly wave count and today is the only hourly wave count.
Wave c pink may unfold either as an impulse or an ending diagonal. Because an ending diagonal requires all subwaves to subdivide into zigzags we can eliminate this possibility because the first wave up subdivides into an impulse.
Within wave (iii) green so far waves i, ii, iii and probably iv orange are complete. Importantly wave iii orange is shorter than wave i orange and so wave v orange has a maximum length of equality with wave iii orange (because within an impulse the third wave may never be the shortest). This maximum price point is at 1,384.08.
At 1,378 wave v orange would reach 0.618 the length of wave iii orange.
At 1,379 wave (iii) green would reach 1.618 the length of wave (i) green. This gives us a 1 point target zone for tomorrow with a reasonable probability.
When wave (iii) green is a complete impulse then we should expect a longer lasting more time consuming fourth wave correction for wave (iv) green. Wave (iv) green may not move into wave (i) green price territory. Wave (iv) green should last at least one session, and depending upon what structure it takes may last longer. This wave count is invalidated with movement below 1,357.79.
We may use Elliott’s channeling technique about an impulse to draw a narrow parallel channel about wave (iii) green. The first trend line is drawn from the highs of waves i to iii orange, then a parallel copy is placed upon the low of wave ii orange. This channel shows where wave iv orange almost ended. We may expect wave v orange to end either mid way within this channel (most likely) or about the upper edge of this channel (less likely).
When this channel is breached by downwards movement then we may expect that wave (iii) green is over and wave (iv) green is underway.
We may also use Elliott’s channeling technique to draw a wider parallel channel about the entire zigzag of wave Y blue. Draw the first trend line from the start of wave a pink to the low of wave b pink, then place a parallel copy upon the high of wave a pink. We may expect wave c pink to end about the upper edge of this channel. When this channel is breached by subsequent downwards movement we shall have our very first indication that wave Y blue (and therefore wave (2) black) is over and the next movement down is underway.
Thanks …. reading it again now
Nice 1391 MAX on the button … http://thepatternsite.com/EWleadingTriangle.html ……… over 1391 we may not have a leading diagonal right??
this is not a leading diagonal because it is in a terminal c wave position (unless you’re working on a completely different wave count to mine).
furthermore there is an error in the rules for the leading diagonal you link to above: they state a rule is the subwave count is 5-3-5-3-5, but the subwave count is more commonly still 3-3-3-3-3 with either of subwaves 1, 3 or 5 subdividing into a five rather than a three. check “Elliott Wave Principle” by Frost and Prechter, 10th edition, page 88