
Last analysis expected upwards movement for Tuesday’s session from both my main and alternate hourly wave counts. The preferred target on the main hourly wave count was 1,364. Price reached 1,365.36, just 1.36 points above the target.
I still have two hourly wave counts for one daily wave count today. We may use parallel channels and confirmation / invalidation points to indicate which wave count is correct in the next session or two.
Click on the charts below to enlarge.
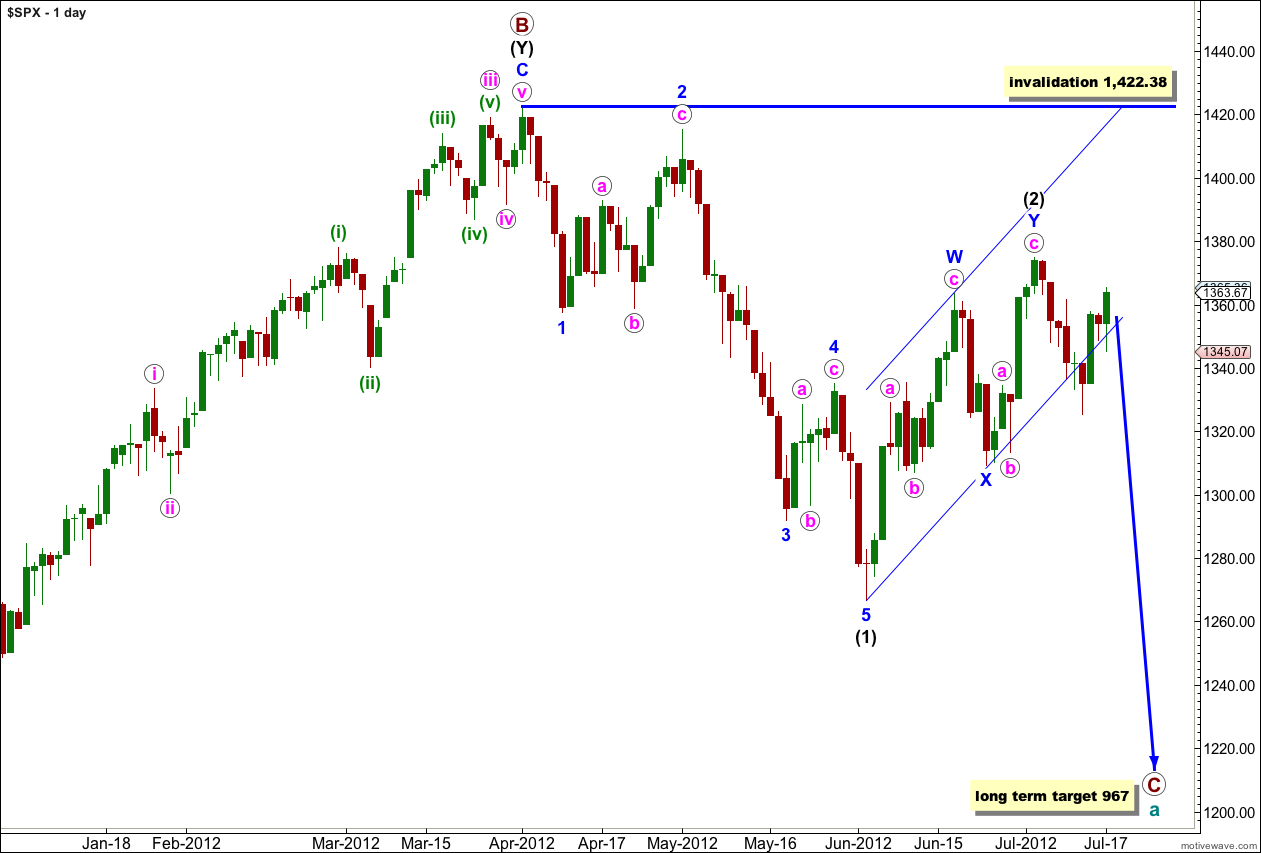
This wave count sees a big trend change at the price high of 1,422.38. Primary wave C should make substantial new lows below the end of primary wave A which had its low at 1,074.77. Primary wave C would reach 1.618 the length of primary wave A at 967, completing a typical expanded flat for cycle wave a.
Within primary wave C wave (1) black is a complete five wave impulse downwards. Wave (2) black is unfolding as a double zigzag structure. The purpose of a double zigzag is to deepen a correction. At this stage the final structure of wave Y blue, the second zigzag, may be either complete or is still a few days away from completion. It looks most like it is complete.
With price moving strongly back into the parallel channel containing wave (2) black we do not have a trend channel breach. Prior to a proper channel breach I will not calculate a target for wave (3) black, it would be premature. We must consider the possibility that there has been no trend change.
Wave (2) black may not move beyond the start of wave (1) black. This wave count is invalidated with movement above 1,422.38.
I have a new alternate hourly chart today which has a much better look and fit than the previous alternate. Today these hourly wave counts diverge. The price point which differentiates them at this stage must be 1,309.27 to the downside and 1,374.81 to the upside.
Main Hourly Wave Count.
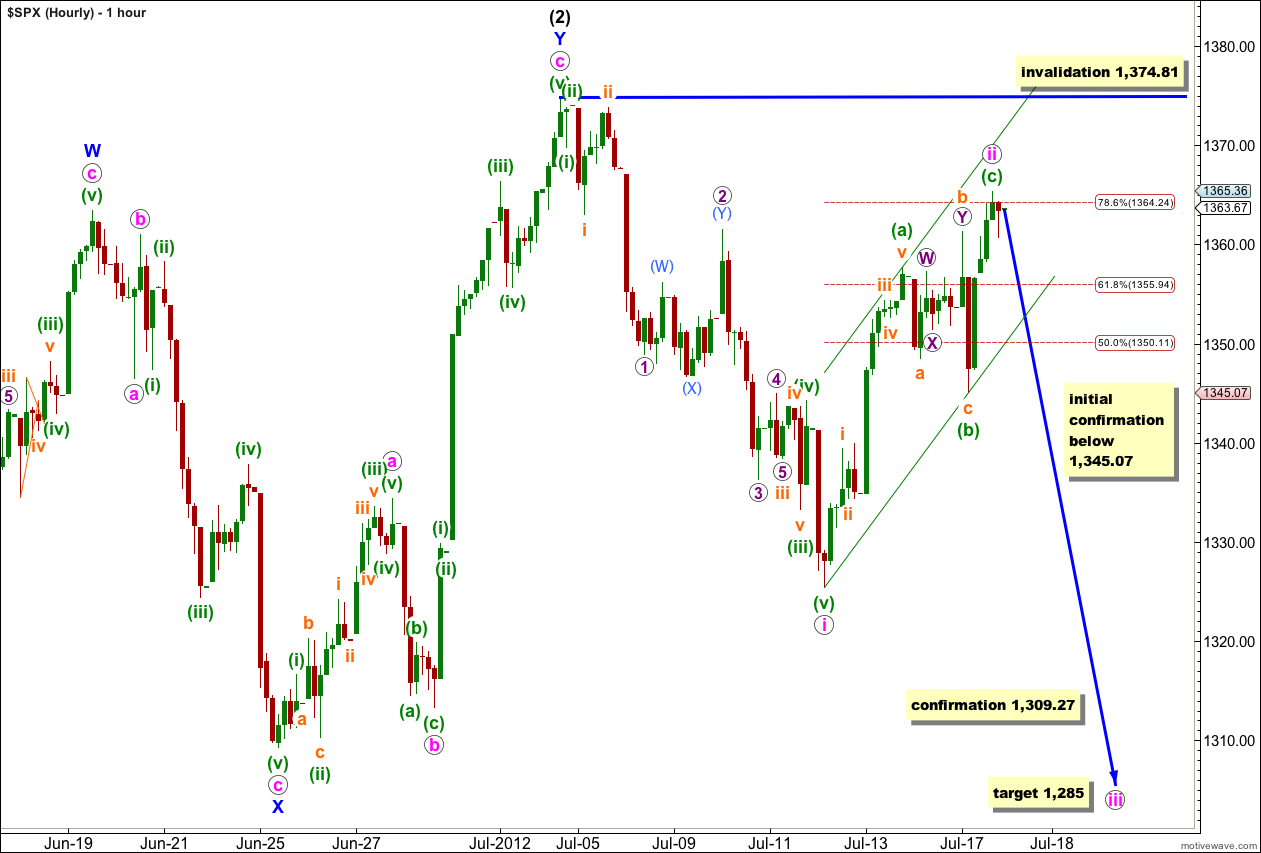
At this stage this wave count has the best look and fit, although the alternate that I have today also has a good fit, and I expect this main wave count is only slightly more likely than the alternate. Without any confirmation of a trend change we must accept the possibility that this main hourly wave count is incorrect and that we may see new highs.
The triangle was a fake (as they unfortunately often turn out to be). There is absolutely no Elliott wave structure which allows for a triangle within that position as it was labeled yesterday. However, price did move sharply out of the movement in the same direction price entered. The following downwards movement labeled c orange within (ii) green is a very clear five wave impulse on the 5 and 1 minute charts; there is no way this could be seen as a three. This is the reason for my labeling today of wave (b) green.
So far from the high labeled (2) black we have a five down followed by a three up. Wave ii pink is a deep zigzag correction, typical of second waves. At this stage wave (c) green within wave ii pink is just 0.33 points longer than 0.618 the length of wave (a) green. Wave (c) green has come close to the upper edge of the parallel channel drawn about the zigzag of wave ii pink.
When this parallel channel is breached by clear downwards movement we shall have our first indication that wave iii pink is underway. If downwards movement is a clear five wave structure we may have more confidence in a third wave.
At this stage at the end of Tuesday’s session there is not enough downwards movement to confirm the end of wave (c) green; the final fifth wave within it could extend higher. However, on the 5 minute chart it does look like a perfectly complete impulse and I am expecting the most likely direction for tomorrow to be downwards.
Initial confirmation of a third wave will come with a trend channel breach, then movement below 1,345.07, and finally confirmation for the third wave at black (intermediate) degree will come with movement below 1,309.27.
The mid term target for wave iii pink is 1,285 where it would reach 1.618 the length of wave i pink.
Any further upwards movement of wave ii pink may not move beyond the start of wave i pink. This wave count is invalidated with movement above 1,374.81.
Alternate Hourly Wave Count.
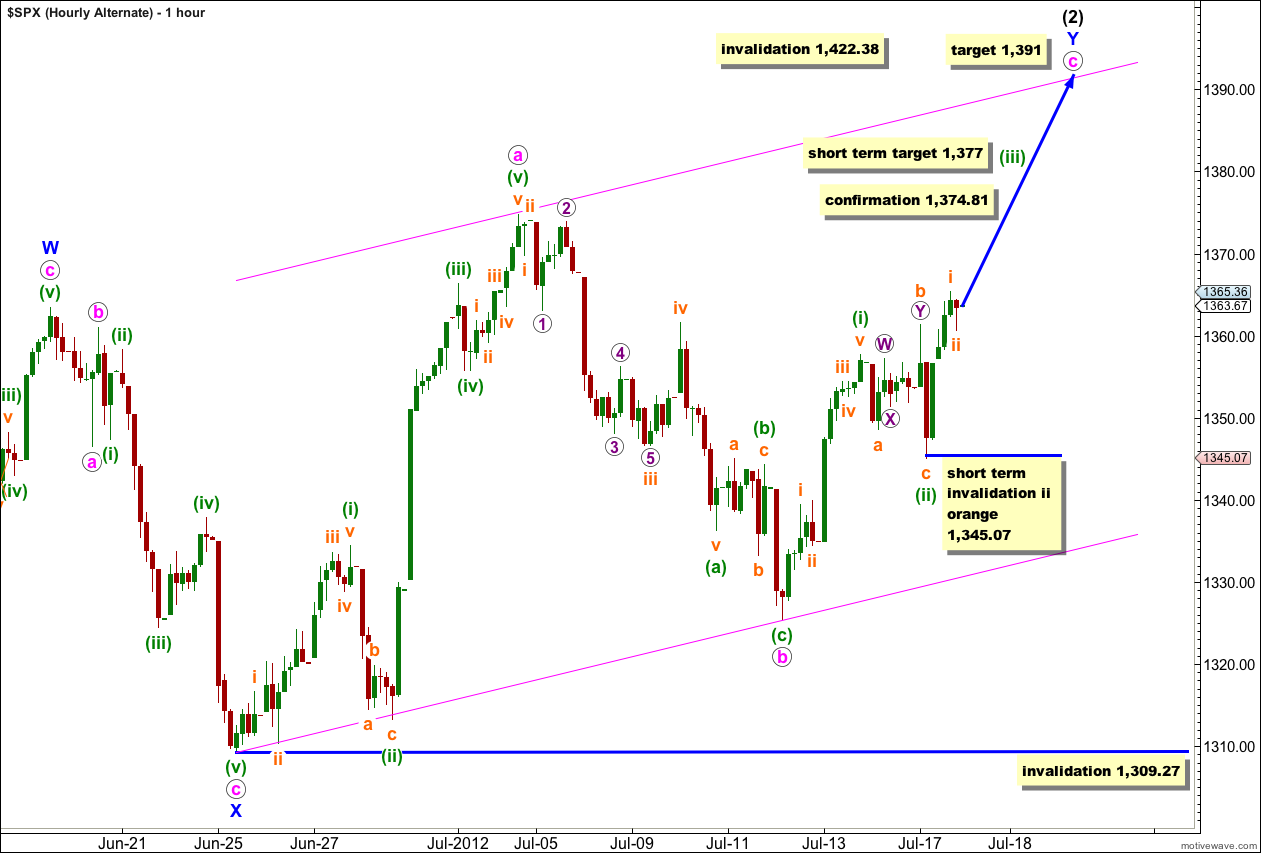
This alternate is the same as the main hourly wave count to the low of wave X blue. Thereafter it diverges.
It is possible that wave Y blue is incomplete and that it is unfolding as an exaggerated zigzag, with wave c pink within it incomplete.
Wave a pink may be seen as a five wave impulse. Wave b pink may be seen as a zigzag (although the rare running flat within it of wave (b) green does reduce the probability of this wave count). Thereafter, wave c pink would be unfolding most likely as an impulse.
At 1,391 wave c pink would reach equality with wave a pink. This may bring price up to the upper edge of the parallel channel drawn here.
In the short term within wave (iii) green wave ii orange may not move beyond the start of wave i orange. This wave count would be invalidated if price moves below 1,345.07 in the next one or two sessions.
In the mid term if wave b pink is not complete, if it continues further as a time consuming triangle or flat, then it may not move below the start of wave a pink. This wave count would be finally and firmly invalidated with any movement below 1,309.27.
Lara and Karen,
I understand your goals of using this comment section for a good and healthy dialogue where members may share thoughts and analysis of the markets. I guess I should have said that I become a bit uncomfortable when I suspect the comment section might be used to solicit clients for another analyst / site. That is why I have not gone to any of the links provided by other members.
So Lara, I give you credit for your openess and trust.
Have a great day.
Rodney
thanks Rodney!
that’s funny, yeah, I do trust a lot, and usually that trust is repaid.
I like to go through life believing the best of people, and all the members here have been very respectful. I really do want you all to communicate with each other here.
I’m much happier with the new hourly wave count, when I developed it as an alternate yesterday it looked really good. This C wave looks like a really typical impulse so far, so the only hard bit may be figuring out when it’s over.
Here’s to intermediate wave (3) black down!
A lot of divergence building up now… ES 1370 took some off the table.
Yes… and Rodney, I will tone it down a bit it what works for me may not work for you.
The goal it to make money everyday 🙂
Lara,
Over the past couple of weeks, I have noticed there are many comments from ‘Karen’ and ‘Frank’. These comments have virtually nothing to do with your analysis. I find these comments to be intrusive and a waste of space.
May I suggest that you block them from their comments or explain to me how they might be helpful.
Thank you,
Rodney
I agree, they have nothing to do with my analysis, but they are focussed on the market I’m analysing.
I expect all members to use other analysis methods, and to be only using my EW wave analysis as one tool in their toolkit for making trading decisions. When your other methods agree with mine you may have more confidence. When your methods disagree with mine it’s up to you which you give more weight.
When my wave count is invalidated then members will have to use their own analysis methods to make decisions.
Karen is giving another perspective on the market, using her own analysis methods. For this reason I’ve left the comments alone.
I want the comments section to be a place where like minded traders (you’re all using EW) can discuss what other methods you use, and your own different take on the market, including your own wave counts.
I expect you all will disagree with each other sometimes, and that’s okay.
Does this make sense?