
Last analysis expected the S&P 500 to move lower at the beginning of Monday’s session which is exactly what has happened.
I still have one daily wave count and two hourly wave counts. We may use the parallel channel on the daily chart, and the confirmation / invalidation point will indicate when we may be confident of a trend change.
Click on the charts below to enlarge.
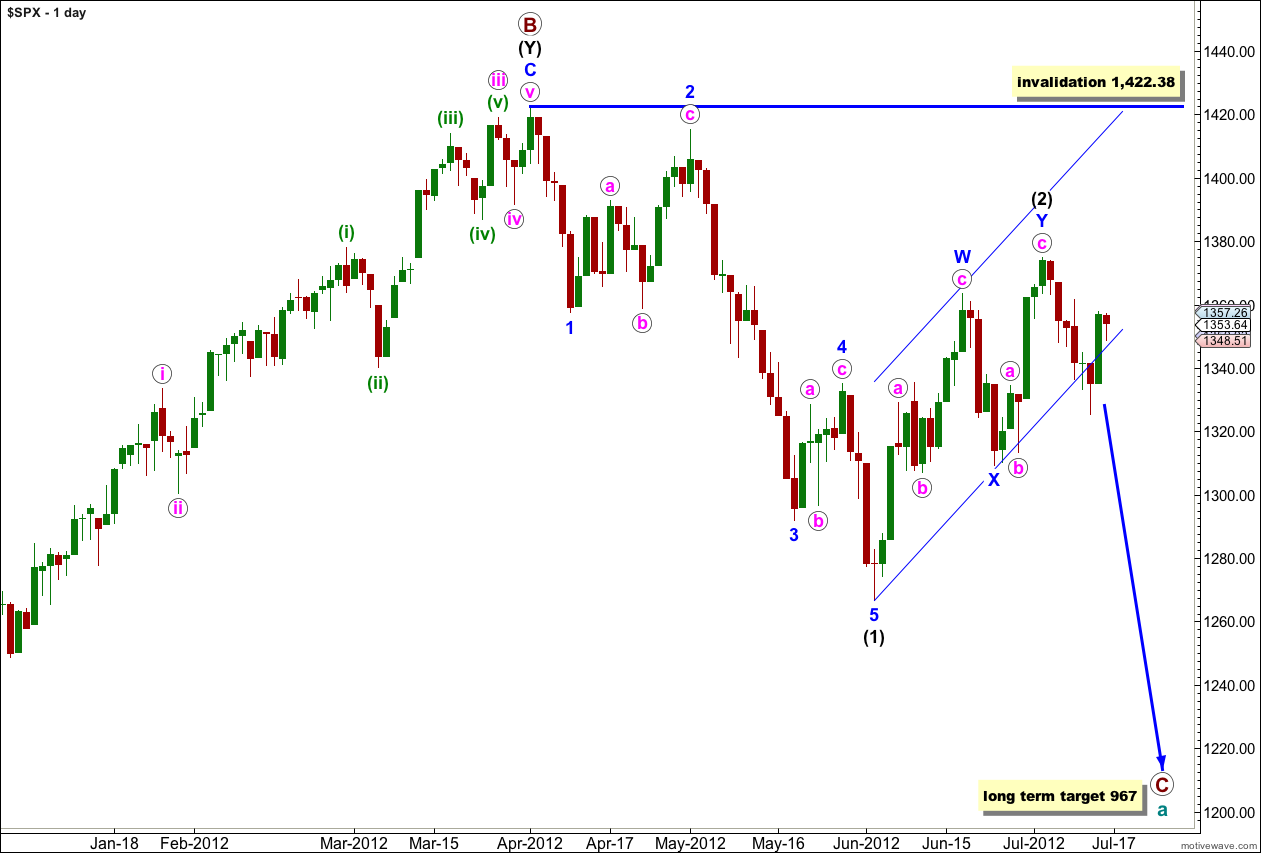
This wave count sees a big trend change at the price high of 1,422.38. Primary wave C should make substantial new lows below the end of primary wave A which had its low at 1,074.77. Primary wave C would reach 1.618 the length of primary wave A at 967, completing a typical expanded flat for cycle wave a.
Within primary wave C wave (1) black is a complete five wave impulse downwards. Wave (2) black is unfolding as a double zigzag structure. The purpose of a double zigzag is to deepen a correction. At this stage the final structure of wave Y blue, the second zigzag, may be either complete or is still a few days away from completion.
With price moving strongly back into the parallel channel containing wave (2) black we do not have a trend channel breach. Prior to a proper channel breach I will not calculate a target for wave (3) black, it would be premature. We must consider the possibility that there has been no trend change.
Wave (2) black may not move beyond the start of wave (1) black. This wave count is invalidated with movement above 1,422.38.
I have the same two hourly wave counts today which look at this most recent movement differently. Today these hourly wave counts have no divergence. They both expect upwards movement. If price reaches above 1,374.81 we will have clarity, and if it fails to move above this price point then both hourly charts will remain valid.
Main Hourly Wave Count.
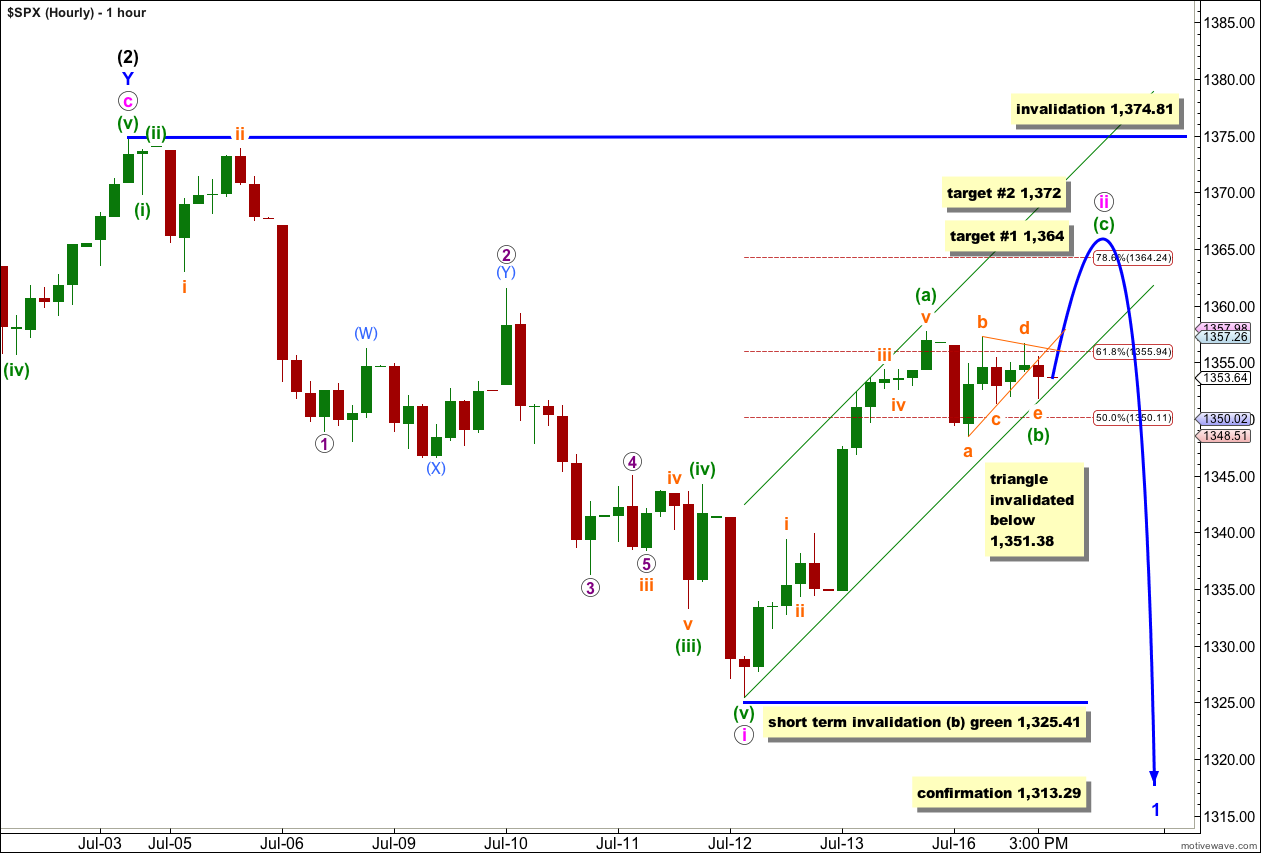
At this stage this main hourly wave count has the best look and a very good fit; it has a higher probability than the alternate below.
Within the very early stages of wave (3) black downwards we have the first five down labeled wave i pink. Upwards movement is wave ii pink.
Within wave ii pink wave (a) green subdivides into a five suggesting a zigzag is unfolding. Monday’s lower and sideways movement subdivides perfectly into a complete contracting triangle. All subdivisions on the 5 minute chart are correct. For this triangle to remain valid price should not move below the end of wave c orange at 1,351.38. If price does move below that point tomorrow then the triangle would be invalidated and a flat or double combination correction for wave (b) green would be likely. I have seen enough structures unfold looking like triangles only to see them turn out to be flats or doubles at the last minute to be aware of this possibility. However in this instance, so far, this triangle structure is perfect and most likely to remain so.
When we see a very good triangle structure unfold (if it remains valid) then we have a very high probability of knowing the next direction out of the triangle will be the same direction as price entered the triangle. In this instance price should move sharply upwards tomorrow. If price does not move below 1,351.38 early tomorrow then I have high confidence we shall see a new high above 1,357.7 at the very least.
We may use Elliott’s channeling technique about this correction. Draw the first trend line from the start of wave (a) green to the end of wave (b) green, then place a parallel copy upon the end of wave (a) green. We may expect wave (c) green to end about the upper edge of this channel, or mid way within it.
At 1,364 wave (c) green would reach 0.382 the length of wave (a) green and price would reach about the 0.786 ratio. This first target is slightly more likely than the second. At 1,372 wave (c) green would reach 0.618 the length of wave (a) green.
Wave ii pink may not move beyond the start of wave i pink. This wave count is invalidated with movement above 1,374.81. If price moves above this point in the next session or two then the alternate wave count below would be confirmed.
Alternate Hourly Wave Count.
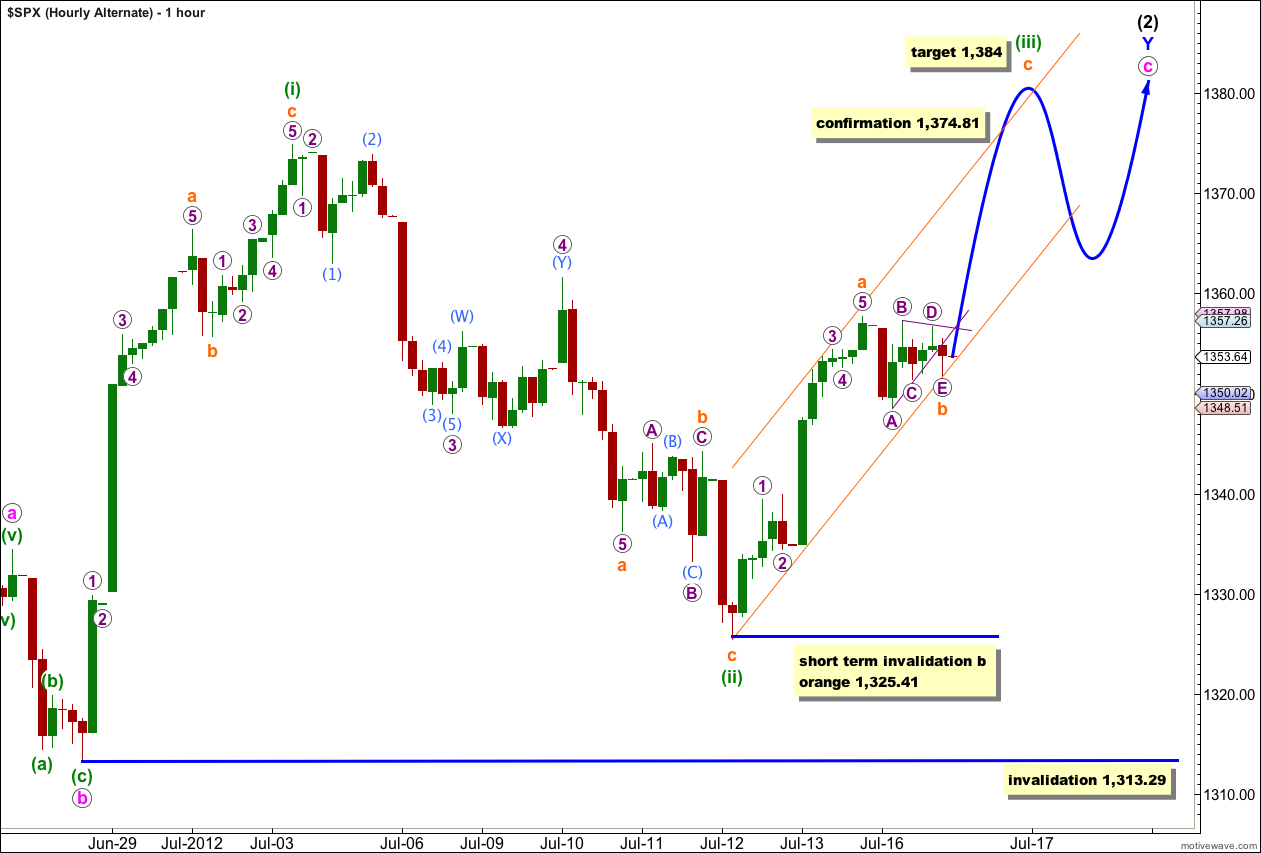
Within recent movement this alternate looks at the same structure unfolding: a zigzag trending upwards. In this instance though the zigzag is a third wave of an ending diagonal (the only instance in which you would see a third wave labeled as anything other than an impulse).
Within an ending diagonal all subwaves must subdivide into zigzags, and the third wave must move beyond the end of the first wave. This wave count requires price to move above 1,374.81 to be valid.
Within the zigzag of wave (iii) green at 1,374.81 wave c orange would reach equality with wave a orange. Wave c orange must subdivide into a five.
Within wave (iii) green if wave b orange is not a triangle and moves lower then it may not move beyond the start of wave a orange at 1,325.41.
If wave (ii) green is unfolding as a very large time consuming zigzag and is not over, then any further downwards movement of wave (ii) green may not move beyond the start of wave (i) green. This wave count would be fully and finally invalidated with any movement below 1,313.29.
Noted Karen.
The main count is too bearish and the alternate count too bullish.
There is another count, which is from Apr to June (1422-1264) is A wave and B wave is about to end, one more leg for C wave in Aug/Sep and then rock n roll to 1500.
Election Time, liquidity pumping from all the central banks will take effect.
All these postulating is fun but let’s see. Looking to sell @ ES12 1373, stop @ 1383.
A/D Line making new recovery highs on July 2nd above the April high, predicts with 85 to 90% probability that the SPX will trade 10/12% higher than 1375 in the next 3 to 6 months.
That would take us over 1500.00 on the SPX.
Prefer the main count.
18/19 Jul is timing for a turn based on moon cycle.
10 point retrace … then I hope we can take off for Wave (iii) of 3 into 1407 area
Nice and now we are off riding Wave 3 up
Shorted 1356.25 looking for 50 to 62% retrace
Looks like the bottom of the gap will be key today ES 1356.50 (50 to 62% retrace because of the divergence building on the 4 hour) trading at 1355.00 currently.