
Last analysis expected the S&P 500 to move higher to begin Thursday’s session, and thereafter to turn downwards. Price did not move higher as expected, but downwards movement remains comfortably above the invalidation point.
With the current structure not unfolding as expected I have looked for an explanation and so the wave count is adjusted.
I still have just the one daily wave count and two hourly wave counts for it.
Click on the charts below to enlarge.
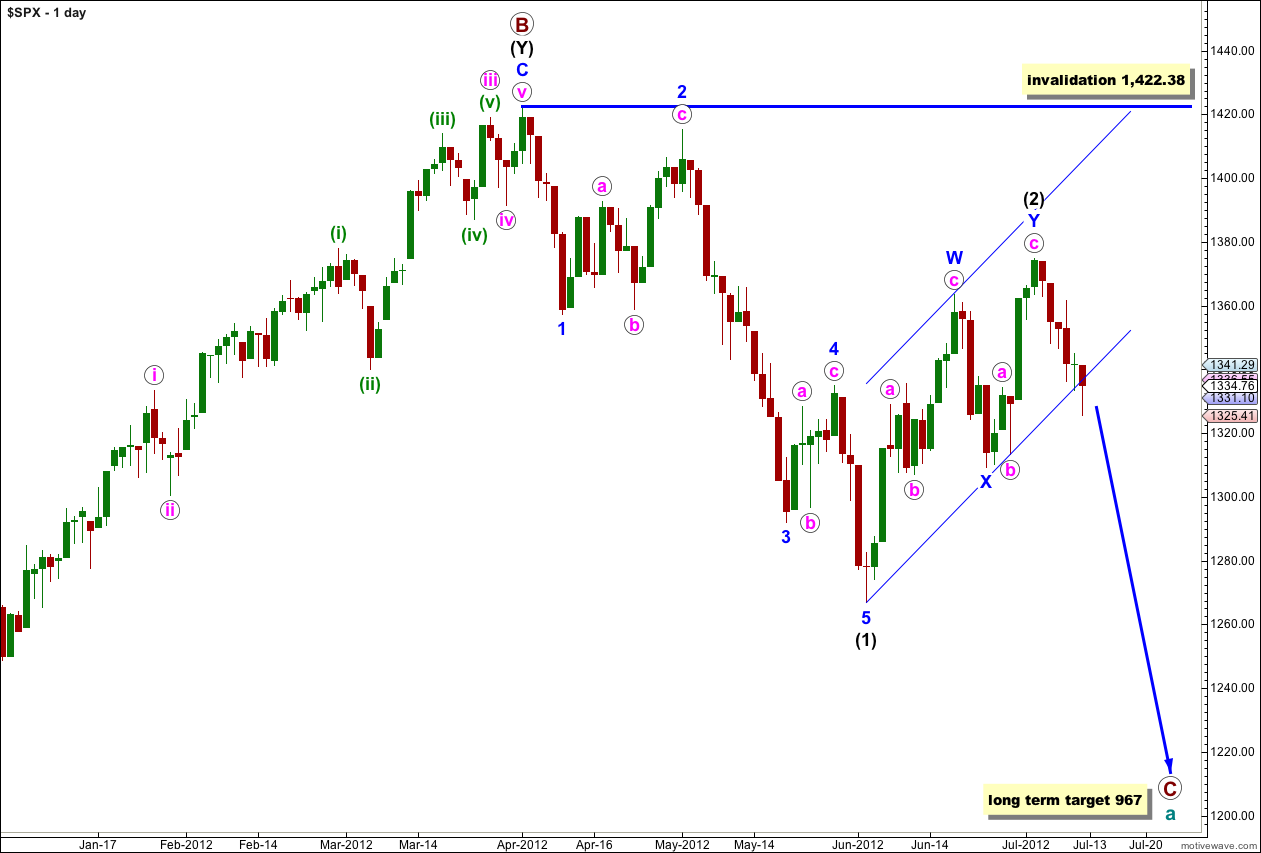
This wave count sees a big trend change at the price high of 1,422.38. Primary wave C should make substantial new lows below the end of primary wave A which had its low at 1,074.77. Primary wave C would reach 1.618 the length of primary wave A at 967, completing a typical expanded flat for cycle wave a.
Within primary wave C wave (1) black is a complete five wave impulse downwards. Wave (2) black is unfolding as a double zigzag structure. The purpose of a double zigzag is to deepen a correction. At this stage the final structure of wave Y blue, the second zigzag, may be either complete or is still a few days away from completion.
Today we have some movement below the parallel channel containing wave (2) black upwards. For the channel breach to be a convincing breach and not just an overshoot we need to see a full daily candlestick outside and not touching the channel. Prior to a proper channel breach I will not calculate a target for wave (3) black, it would be premature. We must consider the possibility that there has been no trend change.
Wave (2) black may not move beyond the start of wave (1) black. This wave count is invalidated with movement above 1,422.38.
I have the same two hourly wave counts today which look at this most recent movement differently. Today these hourly wave counts diverge, with the main hourly chart expecting a little more downwards movement tomorrow, and the alternate expecting upwards movement.
Main Hourly Wave Count.
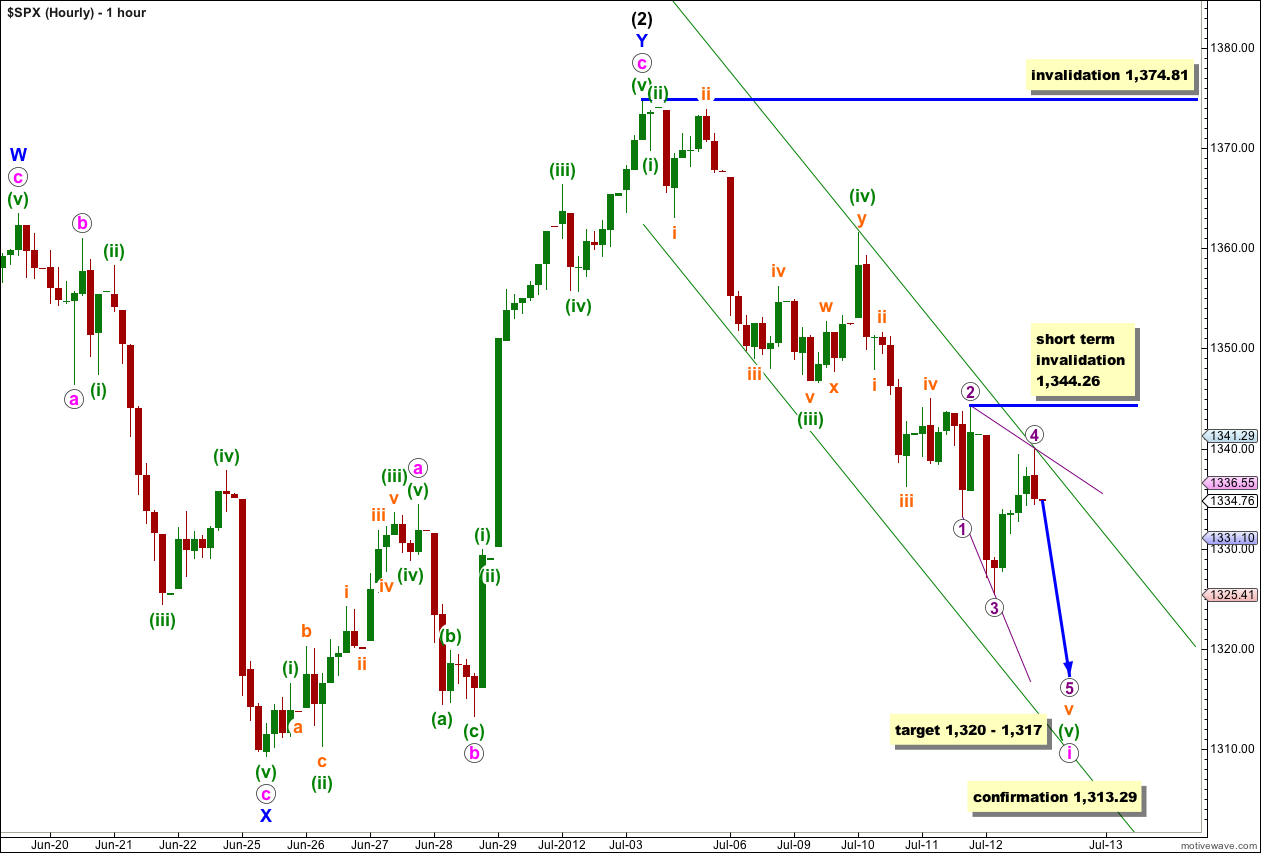
It would be very unlikely that wave ii pink was over as a rare running flat which is how it would have to be labeled if I continued with yesterday’s labeling of recent movement. So I have looked for another explanation. With price moving overall lower in three wave structures at this stage it looks like an ending diagonal is unfolding.
Wave i pink may be incomplete. Within it the final fifth wave of the final fifth wave, wave v orange of wave (v) green, looks like it is unfolding as an ending diagonal. An ending diagonal requires all subwaves to subdivide as zigzags and wave 4 purple should overlap wave 1 purple price territory.
This diagonal is expanding and wave 5 purple should be longer than wave 3 purple. Downwards movement should reach a minimum of 1,321 where wave 5 purple would reach equality with wave 3 purple.
At 1,317 wave (v) green would reach 1.618 the length of wave (i) green. At 1,320 wave v orange would reach 1.618 the length of wave iii orange. This gives us a 3 point target zone for further downwards movement.
We may expect wave 5 purple to fall short of the lower purple trend line containing the diagonal.
I have drawn a best fit parallel channel about this downwards movement. I would expect downwards movement to end mid way within this green parallel channel.
When markets open tomorrow any further upwards movement of wave 4 purple may not move beyond the end of wave 2 purple. This wave count is invalidated in the short term with movement above 1,344.26.
When wave 5 purple completes downwards movement then all wave degrees within wave i pink would again be able to be considered complete. At that stage we may expect a longer lasting and deeper second wave correction for wave ii pink. Wave ii pink may not move beyond the start of wave i pink. This wave count is invalidated with movement above 1,374.81.
Alternate Hourly Wave Count.
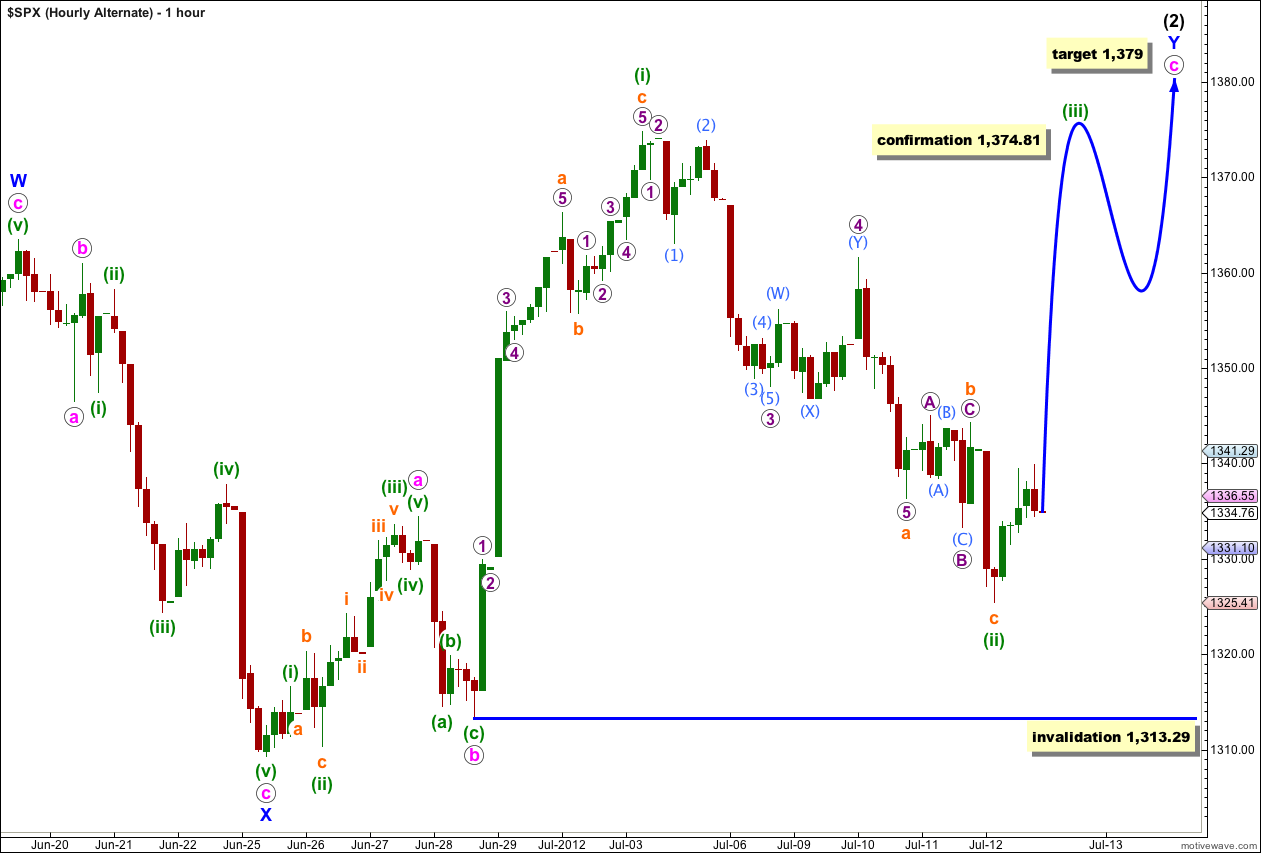
I have left the labeling within downwards movement for this wave count mostly the same as yesterday’s labeling. It is possible that wave b orange was over as a rare running flat correction; all the subdivisions fit on the 5 minute chart (although the main hourly wave count has a better fit).
Wave c orange has no Fibonacci ratio to wave a orange, which is not entirely unusual.
Wave (ii) green is 80% the length of wave (i) green which is within normal expectations for a second wave within a diagonal.
If this wave count is correct then upwards movement is imminent. Wave (iii) green must subdivide into a zigzag and must make a new high beyond the end of wave (i) green. This wave count requires movement above 1,374.81.
Any further downwards movement of wave (ii) green may not move beyond the start of wave (i) green. This wave count is invalidated with movement below 1,313.29.
Also, there is now a hidden very large Inverse Head and Shoulders Pattern on the SPX 4-hr and Daily Chart that with a break of the down sloping neck-line at the 1363 pivot area, measures 155 points to 1363 + 155 => 1518 and agrees with our Wave Theory Count
Looks like Wave (iii) of 1 is topping out ES 1349.75
1363 could be the top of Wave 1
The Market Will Form A ‘Terminal’ High in the coming weeks …. ES 1345 pushing up