
Last analysis expected upwards movement from the S&P 500. Price has closed higher, but moved to make a new low at the beginning of the session. Overall this is what was expected and both hourly wave counts remain valid.
I still have just one daily wave count and two hourly wave counts. At this stage again both hourly wave counts expect exactly the same movement next and they have the same target.
Click on the charts below to enlarge.
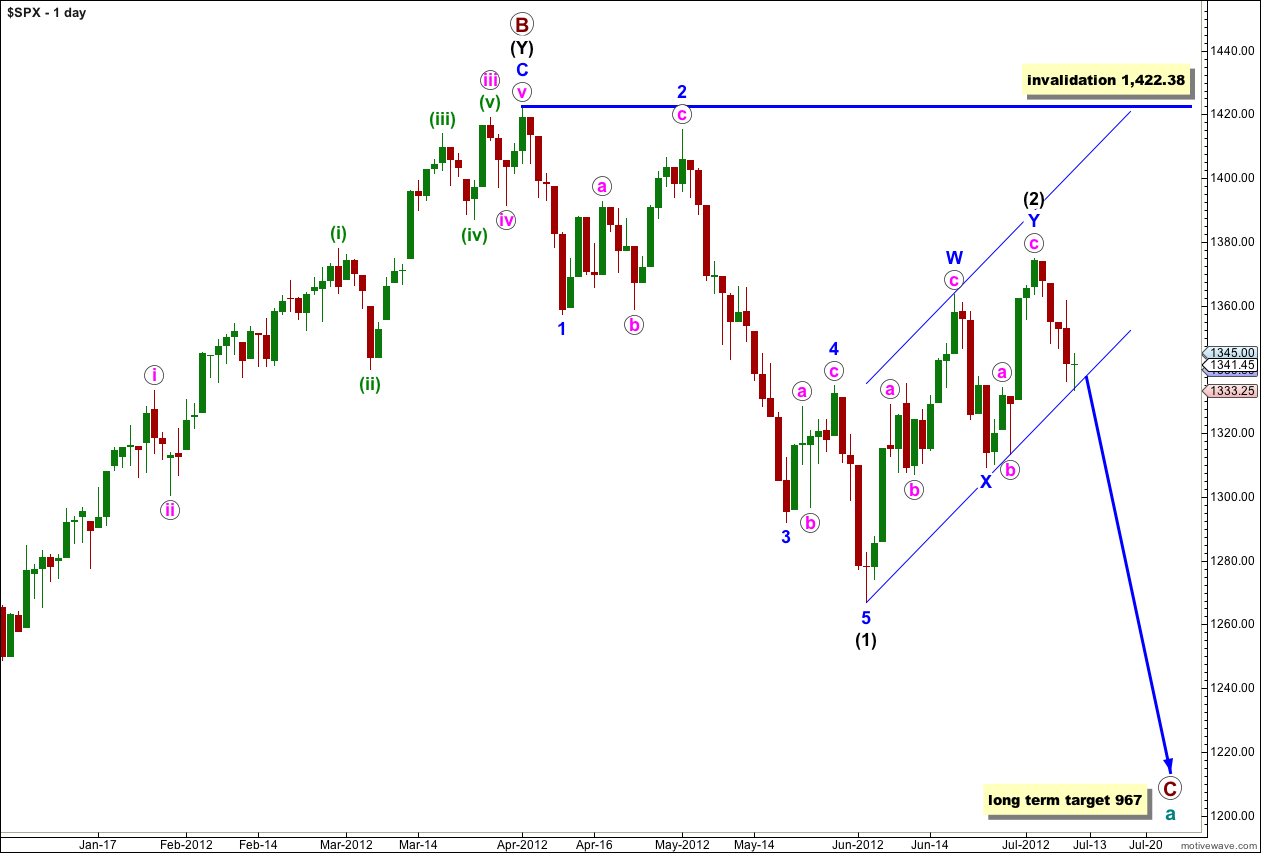
This wave count sees a big trend change at the price high of 1,422.38. Primary wave C should make substantial new lows below the end of primary wave A which had its low at 1,074.77. Primary wave C would reach 1.618 the length of primary wave A at 967, completing a typical expanded flat for cycle wave a.
Within primary wave C wave (1) black is a complete five wave impulse downwards. Wave (2) black is unfolding as a double zigzag structure. The purpose of a double zigzag is to deepen a correction. At this stage the final structure of wave Y blue, the second zigzag, may be either complete or is still a few days away from completion.
Price may have found some support at the lower end of this best fit parallel channel drawn about wave (2) black. This may be where a second wave correction bounces up from. We need to see this channel clearly breached by downwards movement to have confidence in a trend change. Prior to a channel breach I will not calculate a target for wave (3) black, it would be premature. We must consider the possibility that there has been no trend change.
Wave (2) black may not move beyond the start of wave (1) black. This wave count is invalidated with movement above 1,422.38.
I have the same two hourly wave counts today which look at this most recent movement differently. They both expect exactly the same movement for the next one or two sessions. I will swap them over today because at this stage it looks like what was yesterday’s alternate is now slightly more likely.
Main Hourly Wave Count.
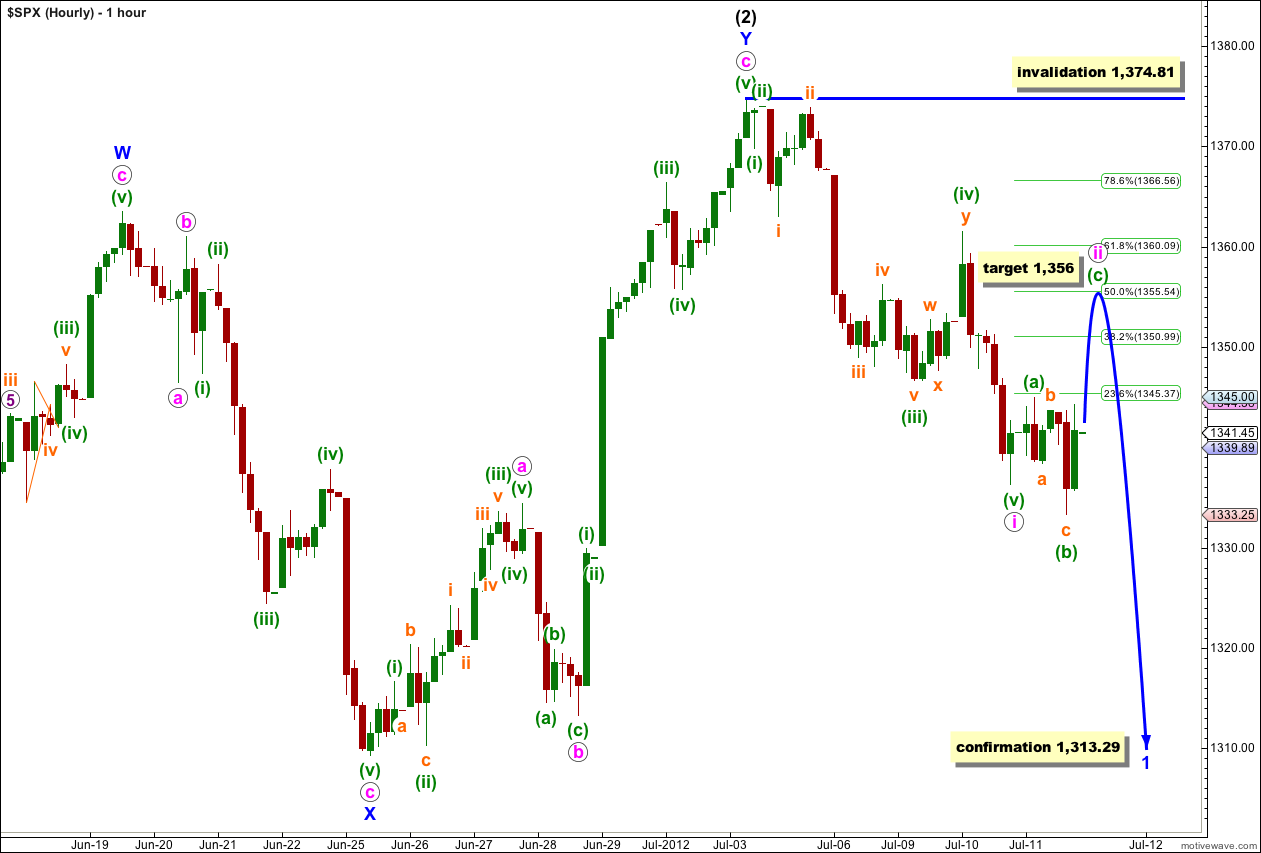
Wednesday’s structure which unfolded subdivides only to the start of an expanded flat correction. Specifically, the downwards movement labeled wave (b) green cannot be seen as a five and must be seen as a three.
Wave ii pink is probably unfolding as an expanded flat. Wave (b) green is a 135% correction of wave (a) green which is a typical maximum for a B wave within a flat correction. At 1,356 wave (c) green would reach 2.618 the length of wave (a) green and wave ii pink would be a 50% correction of wave i pink.
Tomorrow should see overall upwards movement first towards the target. Thereafter, wave ii pink may be complete and a third wave downwards may begin. Alternately, only wave (a) green within wave ii pink may be complete or wave ii pink may continue longer as a sideways double flat correction. We shall have to consider these possibilities after the upwards C wave is complete. A five down to follow would eliminate the possibility of wave ii pink continuing further.
Wave ii pink may not move beyond the start of wave i pink. This wave count is invalidated with movement above 1,374.81.
Alternate Hourly Wave Count.
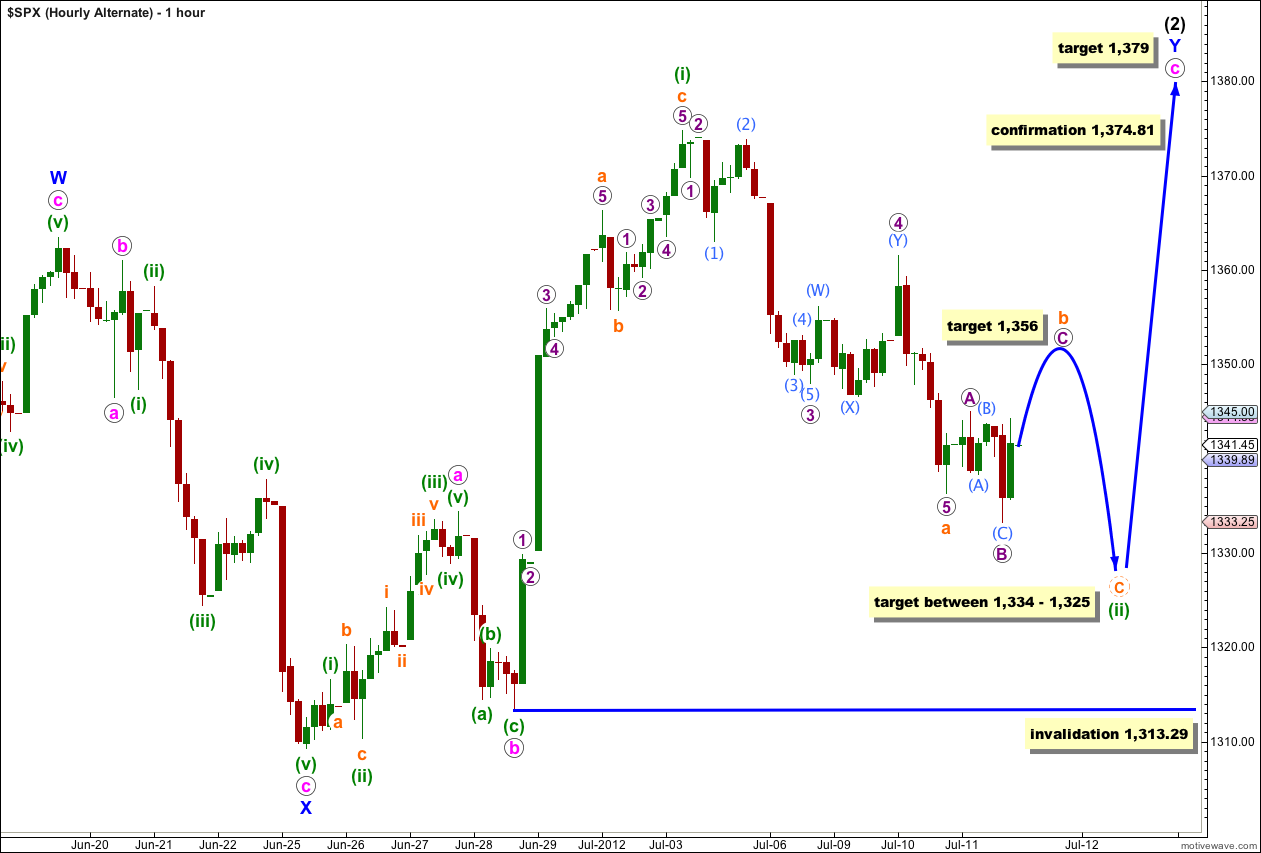
Although wave (ii) green of this possible ending diagonal is now within the typical length for a second wave within a diagonal, the overall structure looks increasingly likely that we have seen a trend change so this is now my alternate wave count by a small margin.
However, while price remains above 1,313.29 this wave count will remain valid and must be considered.
Within wave (ii) green I have adjusted the wave count to be in line with the main hourly chart. So far we have a 5 down labeled wave a orange, and an expanded flat correction may be unfolding for a three up labeled wave b orange. The target for wave b orange is at 1,356 where wave C purple would reach 2.618 the length of wave A purple.
Thereafter, for this alternate, wave c orange downwards should unfold to make a new low below the end of wave a orange (most likely) at 1,336. Wave c orange should end within 0.66 to 0.81 of wave (i) green between 1,334 and 1,325.
When we know where wave b orange has ended then this target for wave c orange may be recalculated and a trend channel may be drawn. The target will narrow and change.
Wave (ii) green may not move beyond the start of wave (i) green. This wave count is invalidated with movement below 1,313.29.
Citi: “The Market Will Form A ‘Terminal’ High”
http://www.zerohedge.com/news/citi-market-will-form-terminal-high
This is what I have been talking about
8/3/2012 1434.44 KEY
Except for the RUT (which is even more bullish than the rest), the DJIA, SPX and Nasdaq all completed what is a near perfect minor C=A at today’s low of a what could be running correction for major [2]-P3-C3.
FYI: And a running correction (if that is what we have had here the past couple of weeks) are insanely bullish.
Don’t forget that A/D line that made new highs last week and after 1 week passes predicts much higher highs for Equities over 3 to 6 months with a 85 to 90% historical probability going back to the 1940?s.
Brave call – knife edge both ways.
As you say – for the moment banks and China likely lead direction to hopefully provide clarity one way or the other. China at cliffs edge right now so negative push has good potential to ignite major decline.
Negative China has major global implications – possible minute degree 4th wave up near completion of minor 3 down as of yesterday. Whatever the short term Chinese count there are very bearing implications looming.
http://twitpic.com/a6x3yh
http://twitpic.com/a6x4i6
NYMO was over upper BB LINE 101 with ES 1375 and now NYMO under lower BB LINE -34 with ES 1319.75
1st goal 1347.25
looks like a nice broadening top if we hit the upper trend line now which will be over 1375
NYMO 101 down to -34
Could be a turning point… http://scharts.co/IHGCkT
It is all about the banks now and Libor now
On Friday morning in Beijing — or 10 p.m. Thursday in New York — China will announce its official economic growth numbers for the second quarter.
This will be big…