
The S&P 500 moved mostly sideways and slightly lower during Monday’s session, remaining well within the confirmation / invalidation points for both hourly wave counts and providing us with no clarification. We need to see price break out of this range before we can have a clear idea of what structure is unfolding.
I still have the one daily wave count with two hourly wave counts looking at most recent movement in two different ways.
Click on the charts below to enlarge.
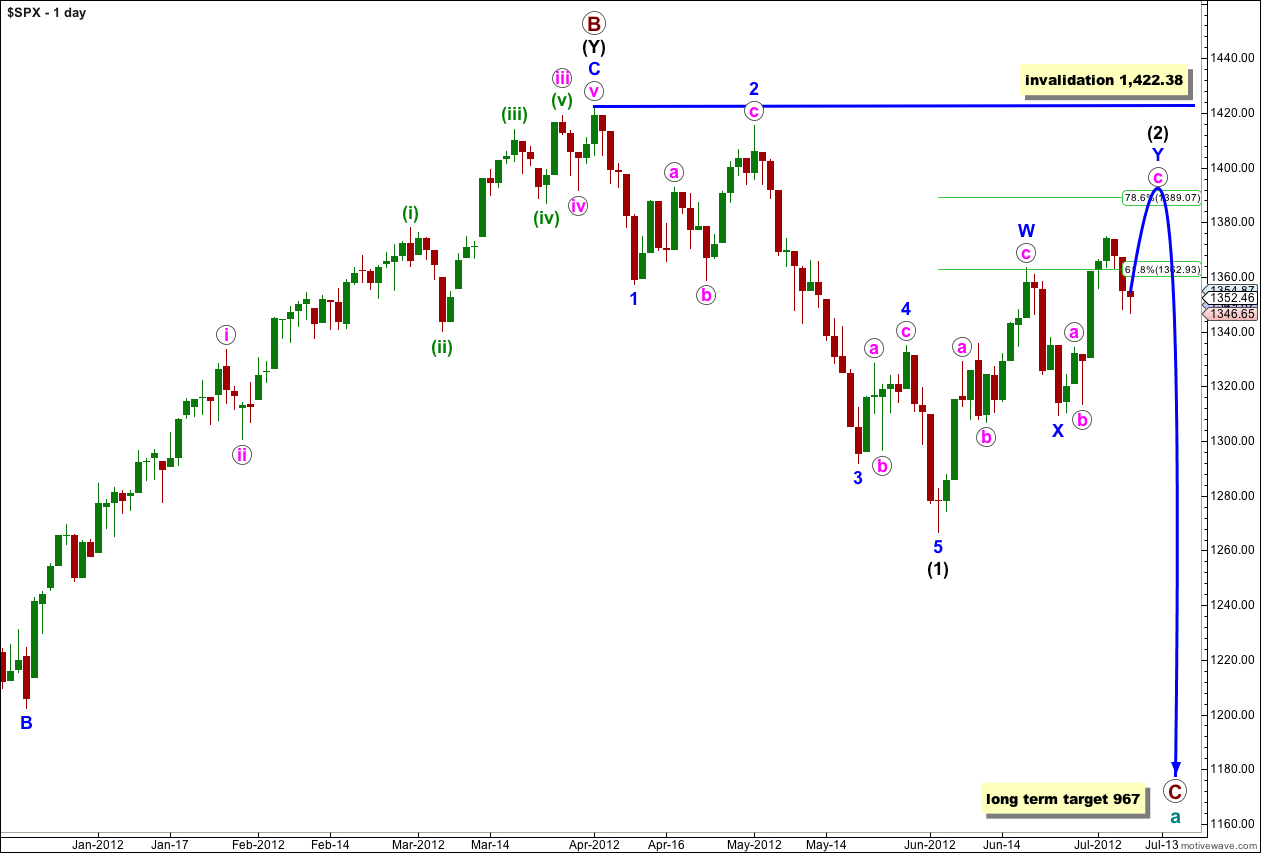
This wave count sees a big trend change at the price high of 1,422.38. Primary wave C should make substantial new lows below the end of primary wave A which had its low at 1,074.77. Primary wave C would reach 1.618 the length of primary wave A at 967, completing a typical expanded flat for cycle wave a.
Within primary wave C wave (1) black is a complete five wave impulse downwards. Wave (2) black is unfolding as a double zigzag structure. The purpose of a double zigzag is to deepen a correction. At this stage the final structure of wave Y blue, the second zigzag, may be either complete or about a week away. I have the same two hourly wave counts today which look at this most recent movement differently.
Wave (2) black may not move beyond the start of wave (1) black. This wave count is invalidated with movement above 1,422.38.
Main Hourly Wave Count.
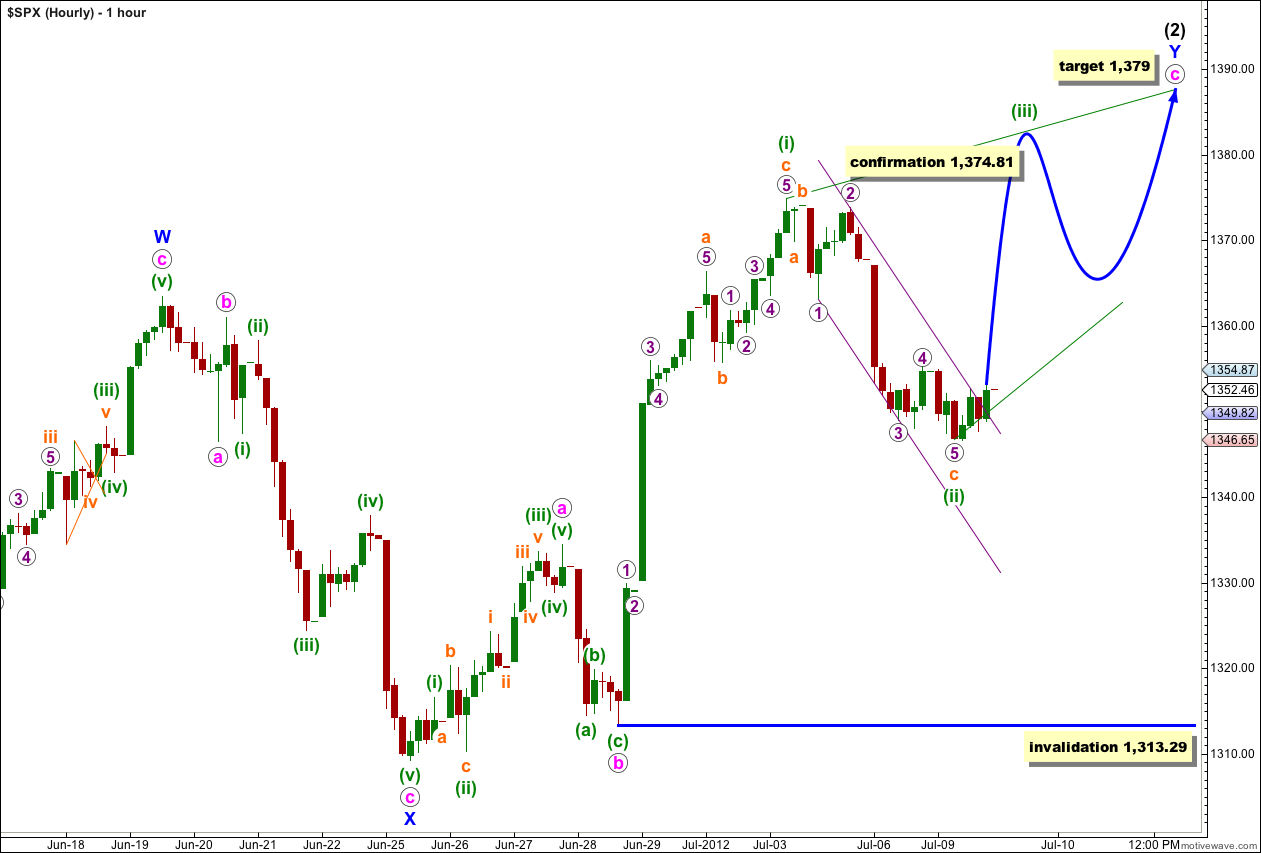
Monday’s sideways and slightly lower movement may have been wave c orange moving lower. Wave (ii) green is only 46% the length of wave (i) green. Second and fourth waves of diagonals are more commonly between 66% and 81% of first and third waves, and we must acknowledge it is possible that wave (ii) green may yet move a little lower to end between 1,334 and 1,325.
If we use Elliott’s first channeling technique to draw a channel about wave c orange within wave (ii) green we see the channel is breached a little by upwards movement at the end of Monday’s session. This may be the first indication that downwards movement is likely to be over for now and wave (iii) green upwards has begun.
Wave (iii) green must subdivide as a zigzag (because this structure for wave c pink is an ending diagonal) and must move beyond the end of wave (i) green. We must see a new high above 1,374.81 for this structure to remain valid. Movement above this price point would also be confirmation of this wave count as at that stage the alternate below would be invalidated.
Wave (iii) green should take about two to four sessions to unfold.
Any further downwards movement of wave (ii) green may not move beyond the start of wave (i) green. This wave count is invalidated with movement below 1,313.29.
Alternate Hourly Wave Count.
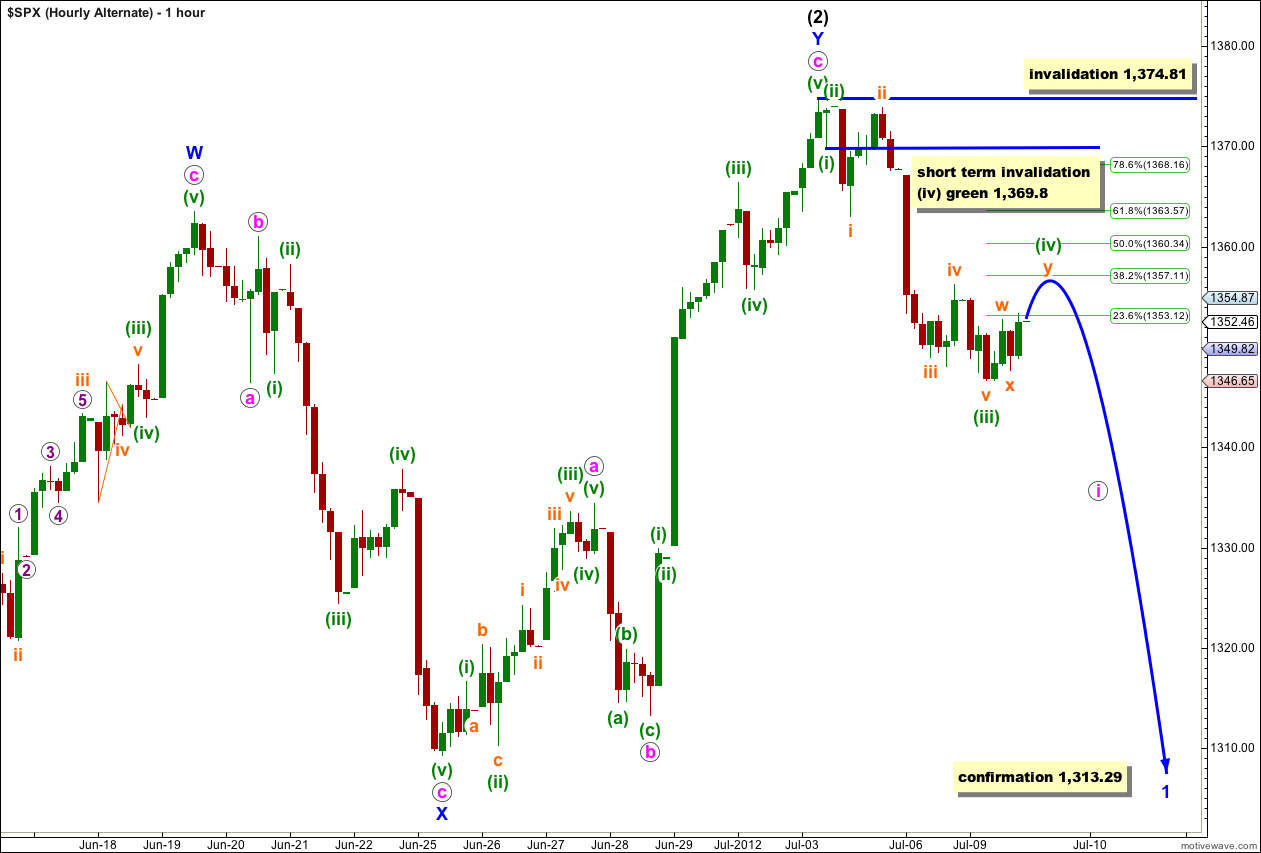
While price remains below 1,369.8 in the short term, and below 1,374.81 in the mid term, this wave count will remain valid. The possibility that wave (2) black is complete and wave (3) black downwards has begun must be considered.
Within the first five down structure of wave i pink waves (i) through to (iii) green are complete. Wave (iv) green may be close to completion, and it would be most likely to end about the 0.382 Fibonacci ratio of wave (iii) green at 1,357.
Thereafter, we should see further downwards movement for wave (v) green to complete wave i pink.
Without knowing where wave (iv) green has ended it is not possible to calculate a target for wave (v) green to end. I would expect wave (v) green to be either equal in length with wave (i) green at 5.01 points, or more likely to be 0.382 the length of wave (iii) green at 10 points.
Wave (iv) green may not move into wave (i) green price territory. This wave count is invalidated with movement above 1,369.8 in the short term.
When wave i pink is over then the following wave ii pink may not move beyond the start of wave i pink. This wave count is invalidated with movement above 1,374.81.
Congrats Karen! Too bad I didn’t take your advice.
Lara, I think Karen is referring to futures.
Double busting Symmetrical Triangle … APEX is 10:30AM EST measured move ES 1333.00 .
80% of the time the APEX time line will be the turning point.
ES trading 1344.75 now…
I’m looking at that on the 30 minute chart, and I cannot see a triangle there. It does not fit the rules for a contracting triangle, nor an expanding… is this cash or futures Karen? Perhaps I’m looking at different data?