
Downwards movement has invalidated the main and alternate hourly wave counts.
To end the trading week I have two wave counts. We can use confirmation / invalidation points to work with these two wave counts next week.
The sole daily wave count remains valid and is unchanged.
Click on the charts below to enlarge.
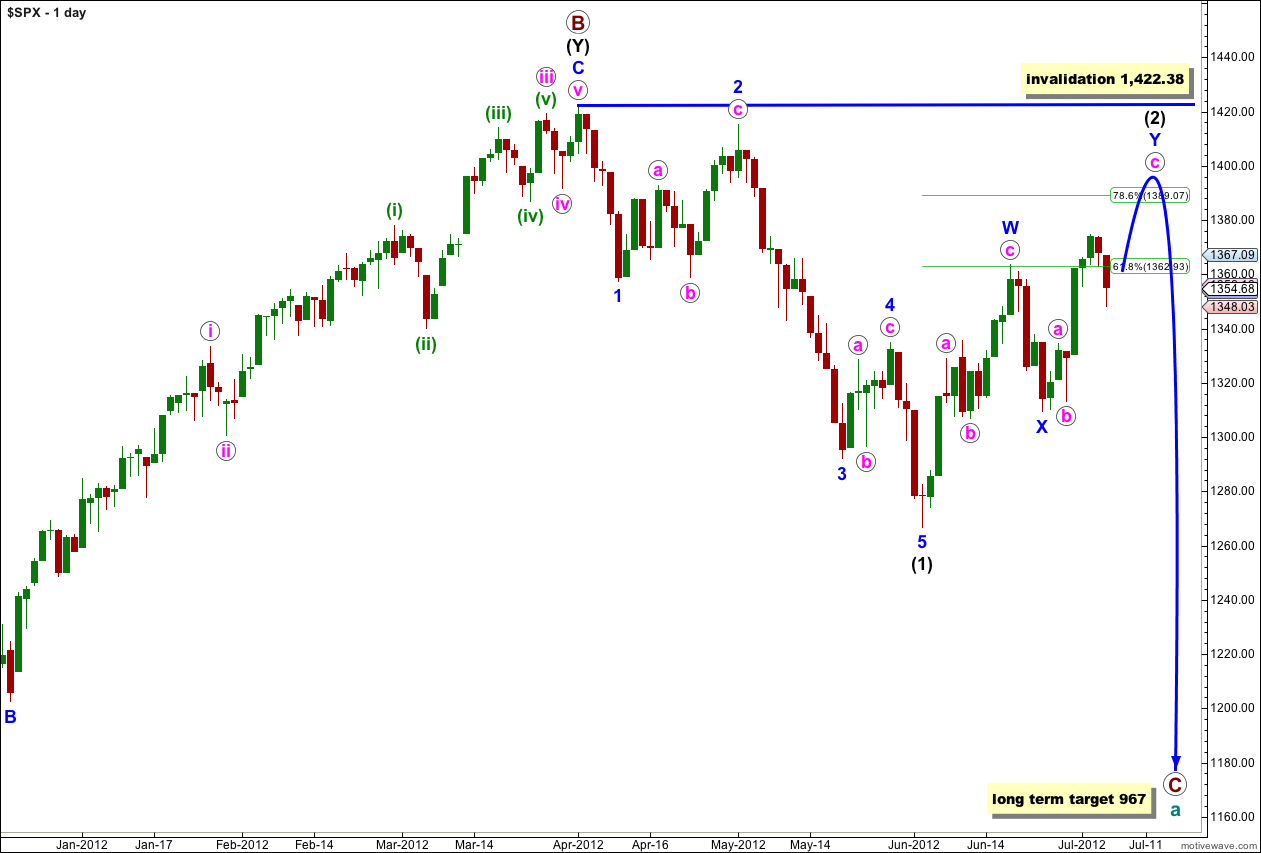
This wave count sees a big trend change at the price high of 1,422.38. Primary wave C should make substantial new lows below the end of primary wave A which had its low at 1,074.77. Primary wave C would reach 1.618 the length of primary wave A at 967, completing a typical expanded flat for cycle wave a.
Within primary wave C wave (1) black is a complete five wave impulse downwards. Wave (2) black is unfolding as a double zigzag structure. The purpose of a double zigzag is to deepen a correction. At this stage the final structure of wave Y blue, the second zigzag, may be either complete or about a week away. I have two hourly wave counts today which look at this most recent movement differently.
Wave (2) black may not move beyond the start of wave (1) black. This wave count is invalidated with movement above 1,422.38.
Main Hourly Wave Count.
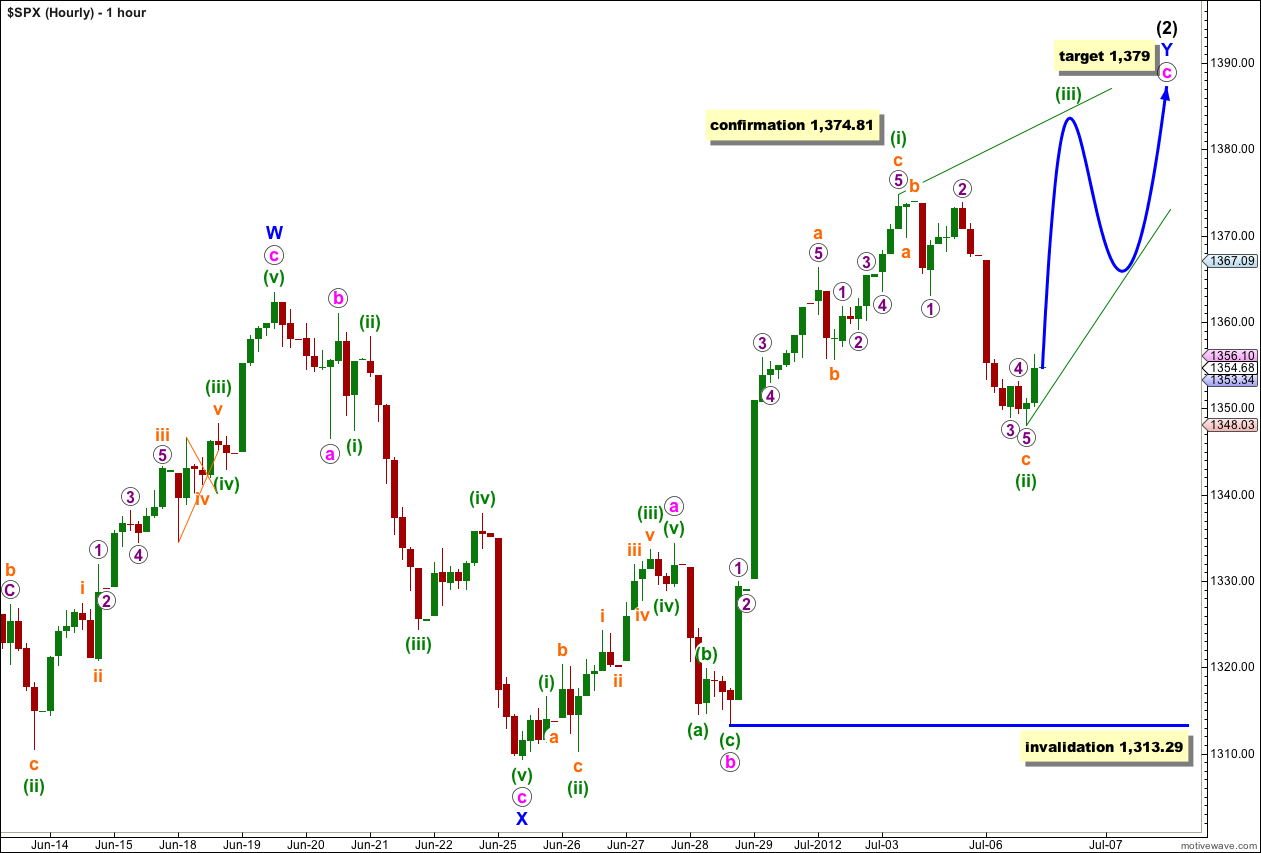
Movement below 1,355.7 invalidated the last hourly wave count. This downwards movement may have been a second wave correction within wave c pink.
This main hourly wave count sees wave c pink as unfolding as an ending diagonal. Wave (ii) green may be over or wave c orange within it may extend lower. Second waves of diagonals normally retrace between 0.66 to 0.81 of the first wave so I would not be surprised at all to see wave (ii) green move lower. If it does then it would be most likely to end between 1,334 and 1,325.
All subwaves of ending diagonals must be zigzags. Wave (iii) green upwards must be a zigzag and must make a new high above the end of wave (i) green at 1,374.81.
Thereafter, wave (iv) green must also be a zigzag which overlaps wave (i) green price territory, but does not move beyond the end of wave (ii) green.
This wave count sees overall upwards movement for another few days yet, in choppy overlapping movement. The target at 1,379 is where wave c pink would reach 2.618 the length of wave a pink and is probably too low. When we have the ends of waves (iii) and (iv) green then a more accurate target for wave (v) green may be calculated.
Wave (ii) green may not move beyond the start of wave (i) green. This wave count is invalidated with movement below 1,313.29.
Alternate Hourly Wave Count.
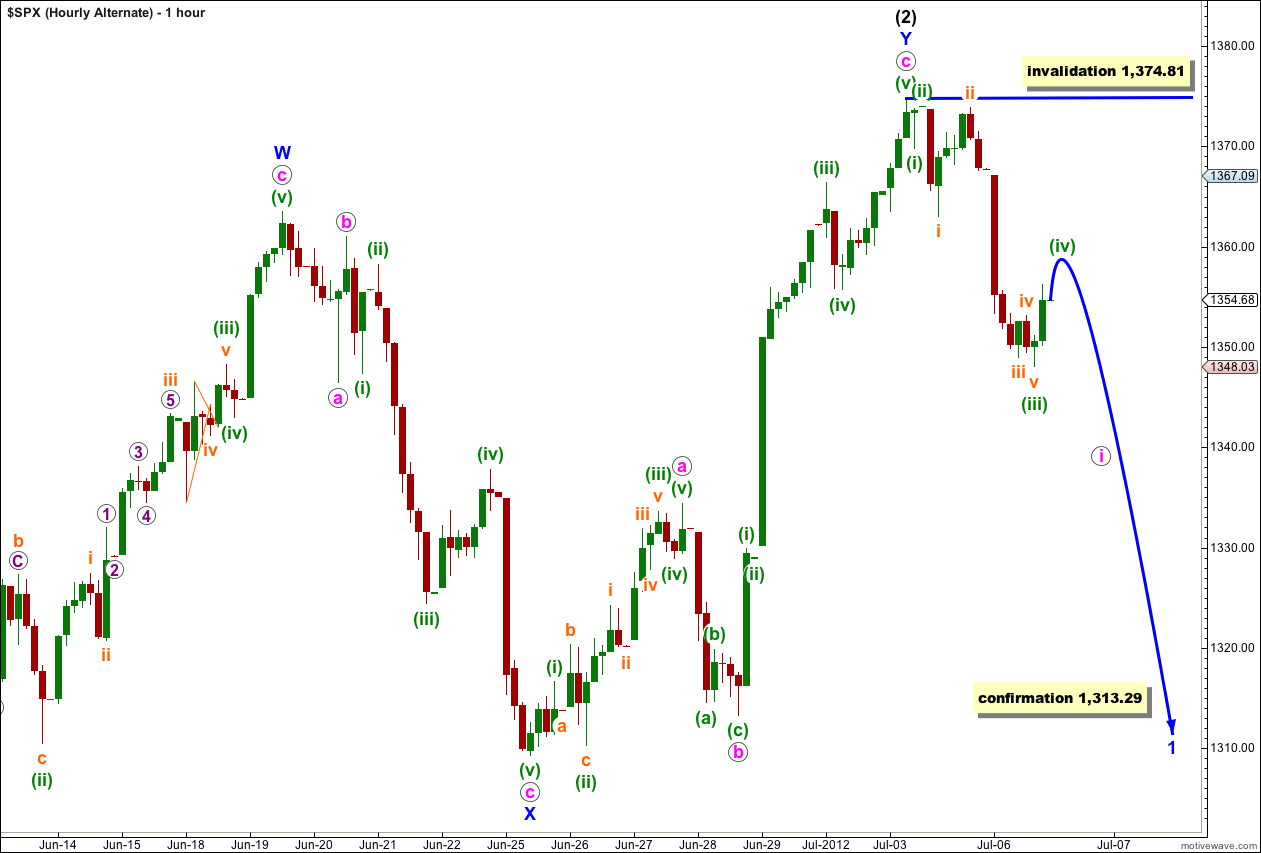
It is possible to see on the 5 minute chart a complete impulse for wave c pink. This alternate does not have as good a fit as the main hourly wave count and has a slightly lower probability.
Movement below 1,313.29 next week would be strong confirmation of a trend change. At that stage we may be reasonably confident that wave (2) black is over and wave (3) black would be underway. When I have confirmation of a trend change at that stage I will calculate a target for wave (3) black downwards. To do so prior to confirmation would be premature.
Within downwards movement so far it looks like a three wave structure. Wave (iv) green should not move into wave (i) green price territory above 1,369.8. Wave (v) green would most likely make a new low below the end of wave (iii) green, at 1,348.03. Waves (iv) and (v) green should complete during Monday’s session.
The following wave ii pink may not move beyond the start of wave i pink. This wave count is invalidated with movement above 1,374.81.
In the short term this wave count would be invalidated with movement above 1,369.8 (prior to wave (v) green downwards unfolding). Movement above 1,363.02 would be a strong indication that the main hourly wave count is more correct and that we should expect new highs.
Symmetrical Triangle (15min) Busted patterns (when the breakout is in one direction only to see price reverse and breakout in the opposite direction) often result in strong moves. However, symmetrical triangles have a tendency to double bust — the final breakout direction is the same as the original one. ES SMA(50) still a good target 1331.25 to finish wave (5) X
Just looking to back test the SMA(50) ES 1332.00 then we go into the 1400s
The trendy, melt up, I anticipated is within the context of Fed intervention, which I suspect is
not going to happen until after the elections later this year. This would mean that any rally will be choppy, and highly volatile. In retrospect, this is of course how a top, tops.
Like it – minuette wave iv (white) is so small but similar trick to what the market has done recently (IE: fourth wave of minute [v] green of minor 1 down).
Need confirmation!
Lara,
It appears that the drop is similar to 2007 drop.
In 2007 ,Intermediate (1) took from Oct 10th to Mar 17th 2008 (5 Mo. 1 Wk.) .Intermediate (2) went from Mar 17 th to May 19th 2008. about 2+ months .
I believe we have just finished Minor 1 and Minor 2 so far as its only been 3 months in total so far ( a degree lower than the count you have)
http://stockcharts.com/h-sc/ui?s=$SPX&p=60&yr=0&mn=1&dy=15&id=p82433627095&a=248458073&r=1341773235947&cmd=print
Any thoughts?
Steve Keen …. concludes (at around 13:00) “you can’t just cure this with deficit spending [since debt is already beyond the black-hole’s ‘event horizon’], you have to abolish the private debt as well” by “quantitative easing for the public”. http://www.youtube.com/watch?feature=player_embedded&v=dsCzqqvIOms#!
Yep – he may be over theoretical and hard to understand but it is timed well that Steve Keen gets a global audience at or near the time it all imlodes.
Quantitative easing for the public is no less outragous than QE for the banks. Rather not have QE at all and let the markets be free to express themselves. But QE for the public would at least remove control away from the hands of banks to directly pay off peoples debt.
Interesting deflationary impact once private debt is paid off I would say but a far better outcome than constantly feeding freebies to the banks .