
Last analysis expected upwards movement. The S&P 500 has moved lower but remains within allowable limits of the wave count, and price remains above the invalidation point.
I have still just the one daily wave count today. I have two hourly wave counts looking at most recent movement in two different ways. We may use confirmation / invalidation points to work with these wave counts over the next day or so.
Click on the charts below to enlarge.
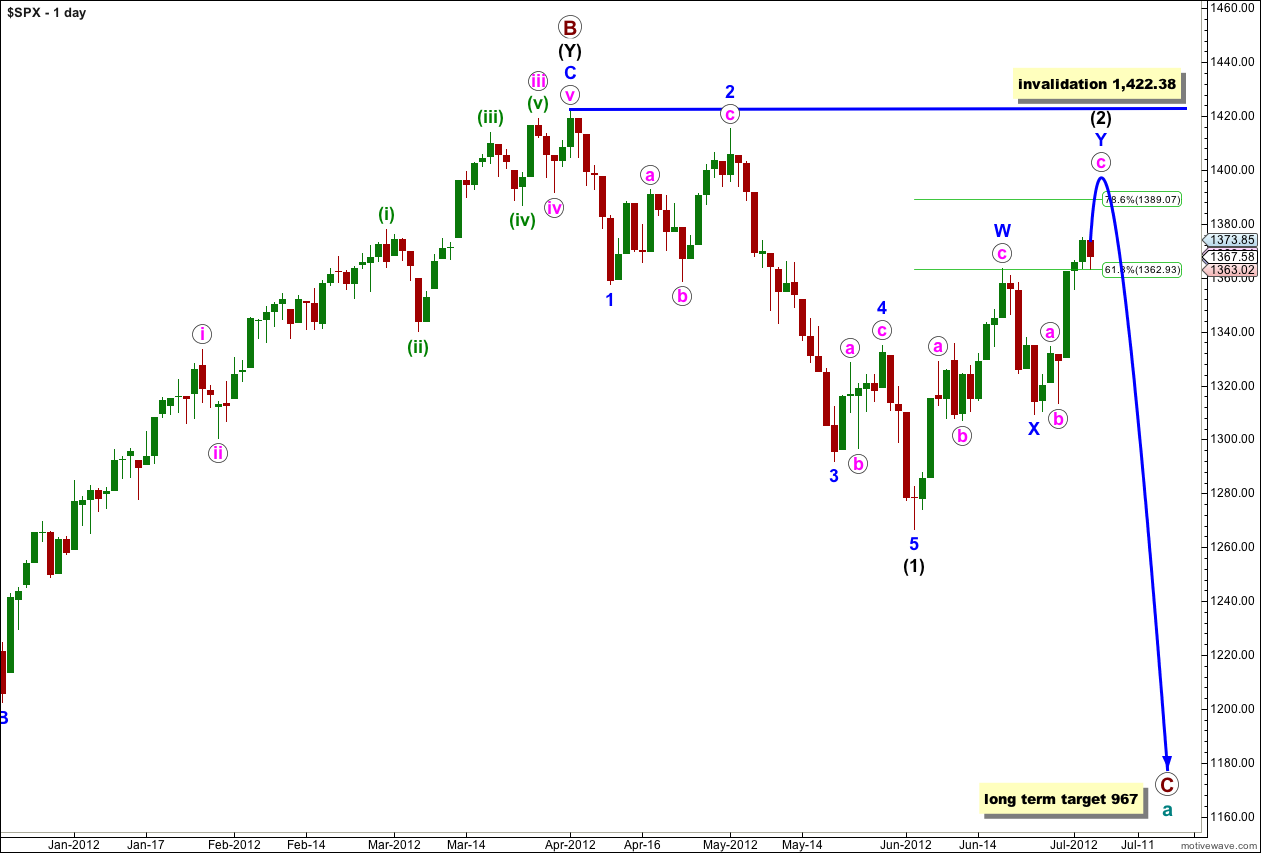
This wave count sees a big trend change at the price high of 1,422.38. Primary wave C should make substantial new lows below the end of primary wave A which had its low at 1,074.77. Primary wave C would reach 1.618 the length of primary wave A at 967, completing a typical expanded flat for cycle wave a.
Within primary wave C wave (1) black is a complete five wave impulse downwards. Wave (2) black is unfolding as a double zigzag structure. The purpose of a double zigzag is to deepen a correction. At this stage the final structure of wave Y blue, the second zigzag, may be either close to completion or about a week away. I have two hourly wave counts today which look at this most recent movement differently.
Wave (2) black may not move beyond the start of wave (1) black. This wave count is invalidated with movement above 1,422.38.
Hourly Main Wave Count.
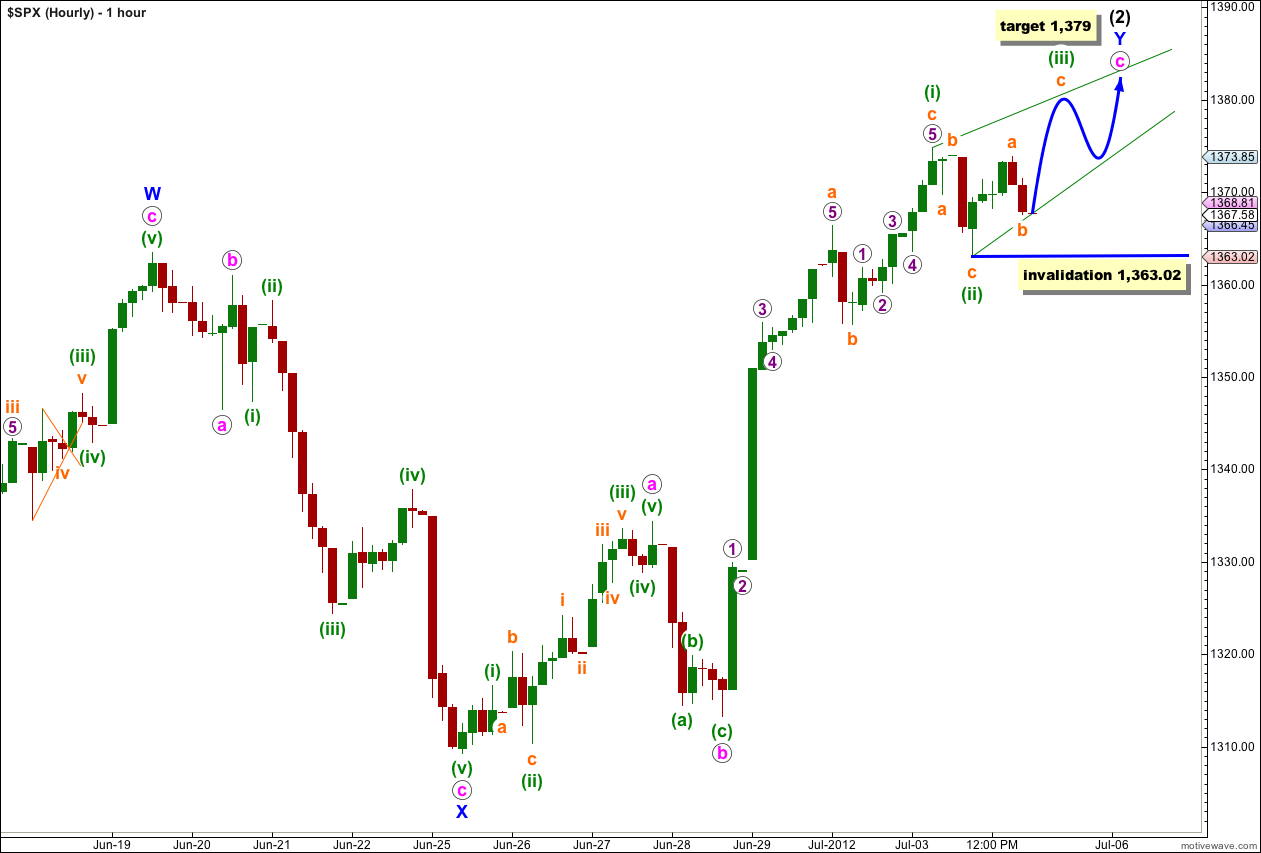
Within the second zigzag labeled wave Y blue, wave c pink may take one of two structures: either an impulse or an ending diagonal. This main hourly wave count sees wave c pink as an ending diagonal. At this stage, after Thursday’s downwards sluggish movement, this main wave count looks very slightly more likely than the alternate.
Within an ending diagonal all subwaves must subdivide into zigzags. With wave (i) green being so long it would most likely be a contracting ending diagonal. Wave (iii) green must subdivide as a zigzag and should be a lot shorter than wave (i) green.
Within the zigzag of wave (iii) green any further downwards movement of wave b orange may not move beyond the start of wave a orange. This wave count is invalidated with movement below 1,363.02. If this wave count is invalidated by downwards movement then we must use the alternate below.
When wave (iii) green is a complete zigzag then the following downwards wave (iv) green must also subdivide as a zigzag and should overlap wave (i) green price territory. Wave (iv) green may not move beyond the end of wave (ii) green. The invalidation point at that stage remains the same at 1,363.02 for this wave count.
At 1,379 wave c pink would reach 2.618 the length of wave a pink. This target is close by and would see a relatively quick and shallow end to upwards movement. Once waves (iii) and (iv) green are complete I can recalculate the target using the green wave degree. It is probably a little too low and will probably change.
When wave (iii) green is complete the upper trend line from the highs of waves (i) to (iii) green would be the best guide to where upwards movement should end. Wave (v) green should end at that upper trend line.
Hourly Alternate Wave Count.
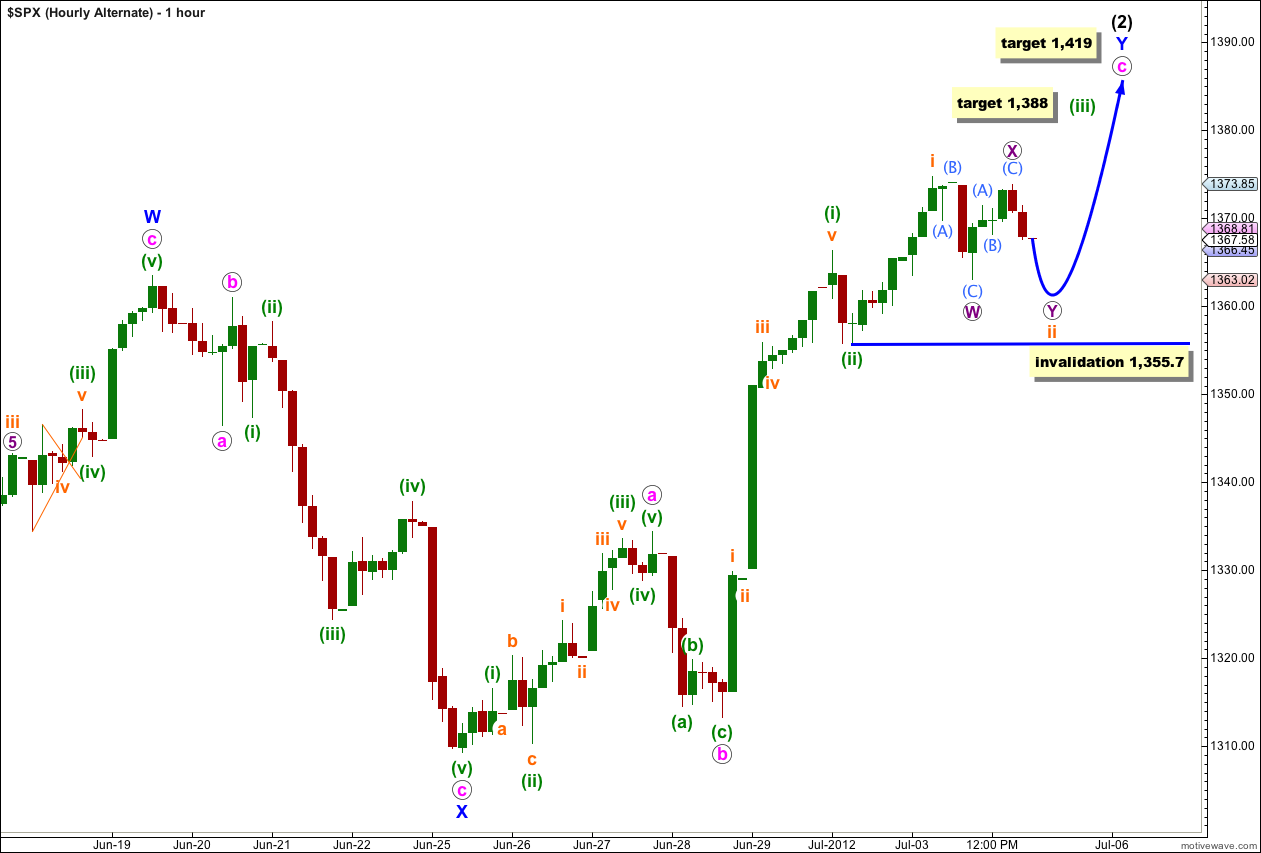
The only other structural option for wave c pink is as an impulse. If this wave count is correct then the middle of the third wave should begin tomorrow with an increase in upwards momentum.
Within wave (iii) green, if it is to be an impulse, I would expect its subwaves ii and iv orange to be clearly visible on the hourly chart. Here wave ii orange may be unfolding as a double zigzag (this is how I have labeled it) or possibly also a flat correction. For both a double zigzag and a flat correction the probability that tomorrow we shall see downwards movement to end slightly below 1,363.02 is very high. Wave ii orange may not move beyond the start of wave i orange, this wave count is invalidated with movement below 1,355.7.
If this alternate wave count is correct then tomorrow should start with a little downwards movement. Thereafter, upwards momentum should be strong and increase as the middle of a third wave unfolds upwards.
At 1,388 wave (iii) green would reach 0.618 the length of wave (i) green.
At 1,419 wave c pink would reach 4.236 the length of wave a pink.
This alternate wave count has only a slightly lower probability than the main hourly wave count. It sees longer lasting and higher highs than the main hourly wave count.
If price remains above 1,363.02 both wave counts will remain valid and only careful attention to structure and subdivisions would indicate which one is correct.
Either way, the structure of wave c pink is incomplete and we should see further upwards movement before it could possibly be over.
Lara – the comment i was alluding to was this: “Karen // Jul 5, 2012 at 2:08 am
…….
we use Unorthodox Wave Analysis and aspects of the original works of R.N. Elliott’s Elliott Wave Principle” . Please dont let people (me included :)) take advantage of your good nature.
No worries, it seems that comment has been removed.
Karen
Whether Lara is right or wrong in her calls i think we owe her the respect of not incessantly promoting other sites. After all this is not a blog so IMO responses should be restricted to questions relating to Lara’s counts and not posting Mc Oscillator levels or particularly promoting other sites.
In particular I refer to the use of “we use a variety of indicators… etc”. If you want to promote your own sites then you should do it on a public blog – not a subscription based service.
I tend to have a lassiez faire approach to members comments here. It’s only viewable by members and I think its great members are sharing ideas.
I could not find the “we use a variety of indicators” comment to judge that one, maybe I’m too slack and missed that one.
When my wave count is wrong it is essential that members use other tools; sometimes EW analysis does not have a clear picture and sometimes (pretty much all of last week) I just get it wrong. So sharing other charts and ideas is exactly what you all need to do, and doing it here is fine by me. In fact it should be encouraged because you’re sharing with others who have a similar approach to analysis in that you’re all using technical analysis and EW in particular.
Promotion of your own sites or promotion of others sites would be crossing a line though and if I saw such comments I’d delete them. At this stage I have not noticed anything which I would want to delete.
My approach to comment moderation is more along the lines of keeping it polite and respectful, which it always is.
ES 1375 top of Wave W
Looks like the bottom of [a] and we need 3 waves up for [b] then 5 waves down for [c] of X.
Then I think we can look for new highs or a Y wave.
What do you think?
Francis … with you and we did have a bullish crossover SMA(10) over SMA(50) this week.
If we go under that band I will be short.
The main idea about long-term is 3 Push Up. Since the 3rd push up failed to touch the up trend line and the price overlapped indicating a weakening in the up momentum, therefore Cobra’s believe this is the last push up. http://www.cobrasmarketview.com/3-push-updown/
One more view point to keep in mind.
Thanks Karen, let’s see if we can get back to 1400.
The first point is that Inflowing Liquidity made a low on June 4th, and it has been rising since. http://www.stocktiming.com/Friday-DailyMarketUpdate.htm ES 1344.25
NYMO was at 101 a few days ago very overbought … ES 1375 …. ABC wave down to 1349.50
Now lets see if we can get back into 1400s