
Movement above 1,366.35 invalidated the main hourly wave count and confirmed the alternate. At that stage I expected price to continue rising towards the target.
I have just the one hourly wave count today.
I will go over an alternate monthly chart and the breakdown of recent movement for this idea on a daily chart at the end of this analysis. At this stage this is the best bullish wave count that I can see.
Click on the charts below to enlarge.
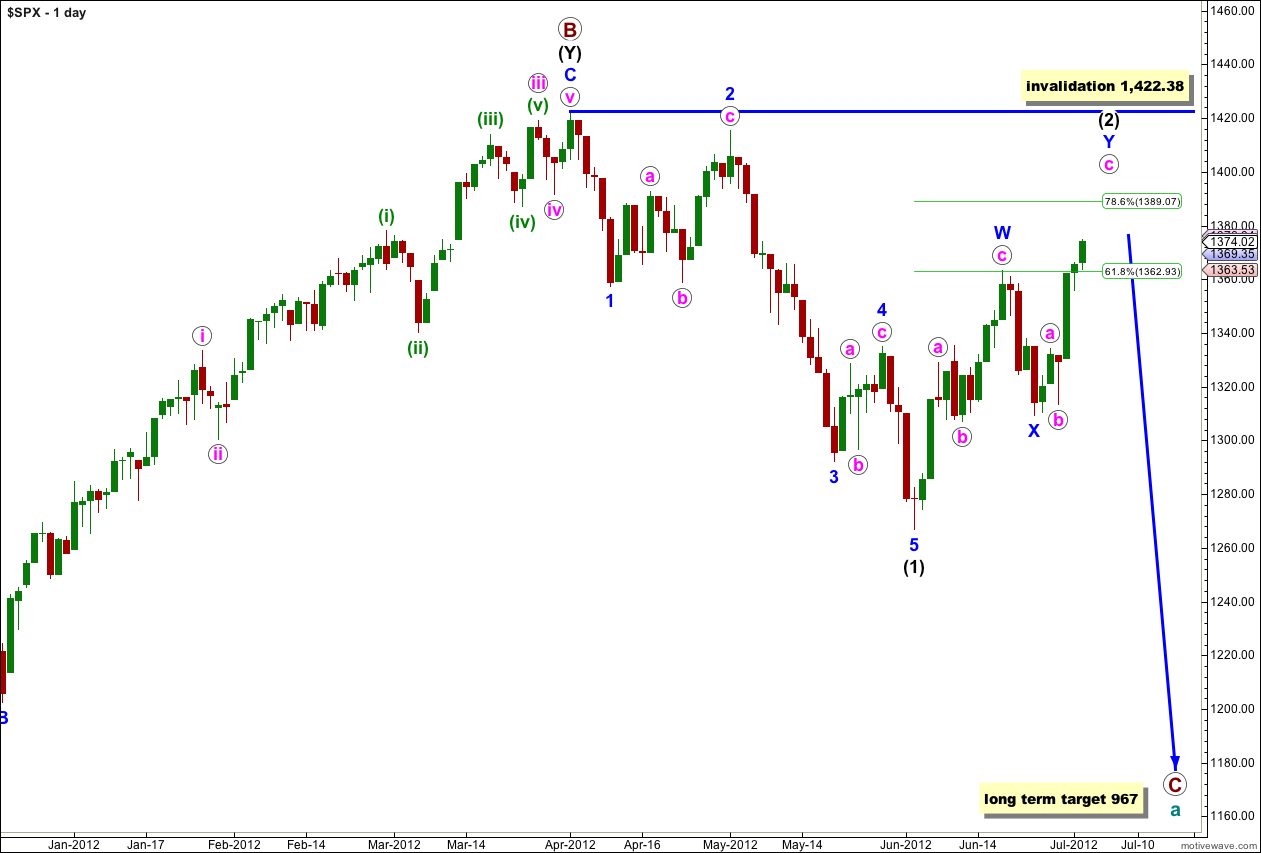
This wave count sees a big trend change at the price high of 1,422.38. Primary wave C should make substantial new lows below the end of primary wave A which had its low at 1,074.77. Primary wave C would reach 1.618 the length of primary wave A at 967, completing a typical expanded flat for cycle wave a.
Within primary wave C wave (1) black is a complete five wave impulse downwards. Wave (2) black is unfolding as a double zigzag structure. The purpose of a double zigzag is to deepen a correction.
Wave (2) black may not move beyond the start of wave (1) black. This wave count is invalidated with movement above 1,422.38.
Within the second zigzag of this double for wave (2) black labeled wave Y blue waves a and b pink are complete.
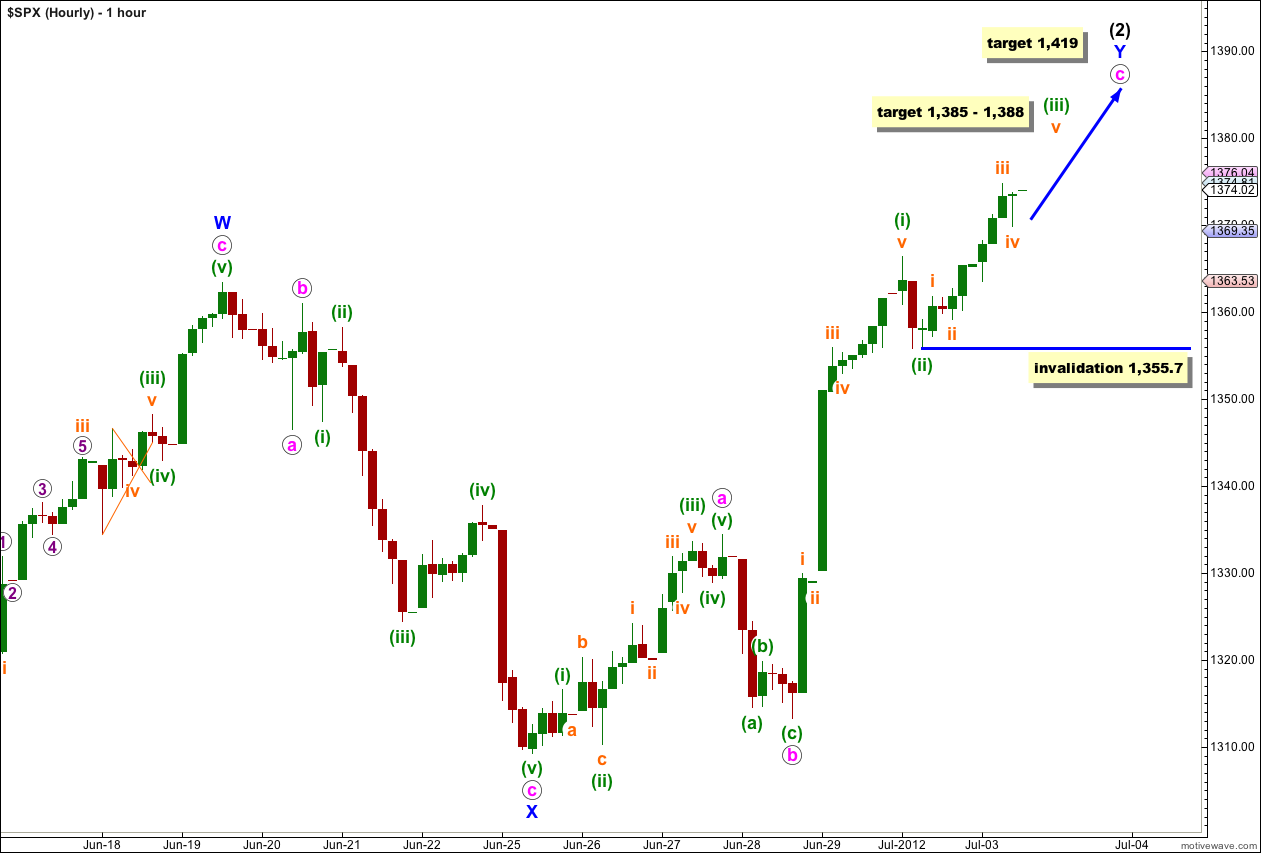
Within wave c pink the structure is incomplete. Waves (i) and (ii) green are probably complete and wave (iii) green is unfolding upwards.
On the 5 minute chart, within wave (iii) green, the structure looks most like it is incomplete as it requires a final fifth wave upwards to end it.
At 1,388 wave (iii) green would reach 0.618 the length of wave (i) green. Within wave (iii) green at 1,385 wave v orange would reach equality with wave iii orange. This gives us a small 3 point target zone which should be reached tomorrow.
When wave (iii) green is complete then we must move the invalidation point up to the end of wave (i) green at 1,366.35. The upcoming fourth wave correction of wave (iv) green may not move into wave (i) green price territory.
While wave (iii) green is incomplete the invalidation point must remain at its start. No second wave correction within wave (iii) green may move beyond its start. This wave count is invalidated with movement below 1,355.7.
At 1,419 wave c pink would reach 4.236 the length of wave a pink. This would bring wave (2) black very close to the start of wave (1) black, making it a very deep second wave correction.
I am publishing today an alternate monthly wave count which has been in the historical analysis for a while now, and a daily chart showing the breakdown of recent movement for this idea. If price moves above 1,422.38 then this alternate idea is the best explanation that I can see.
Alternate Monthly Chart.
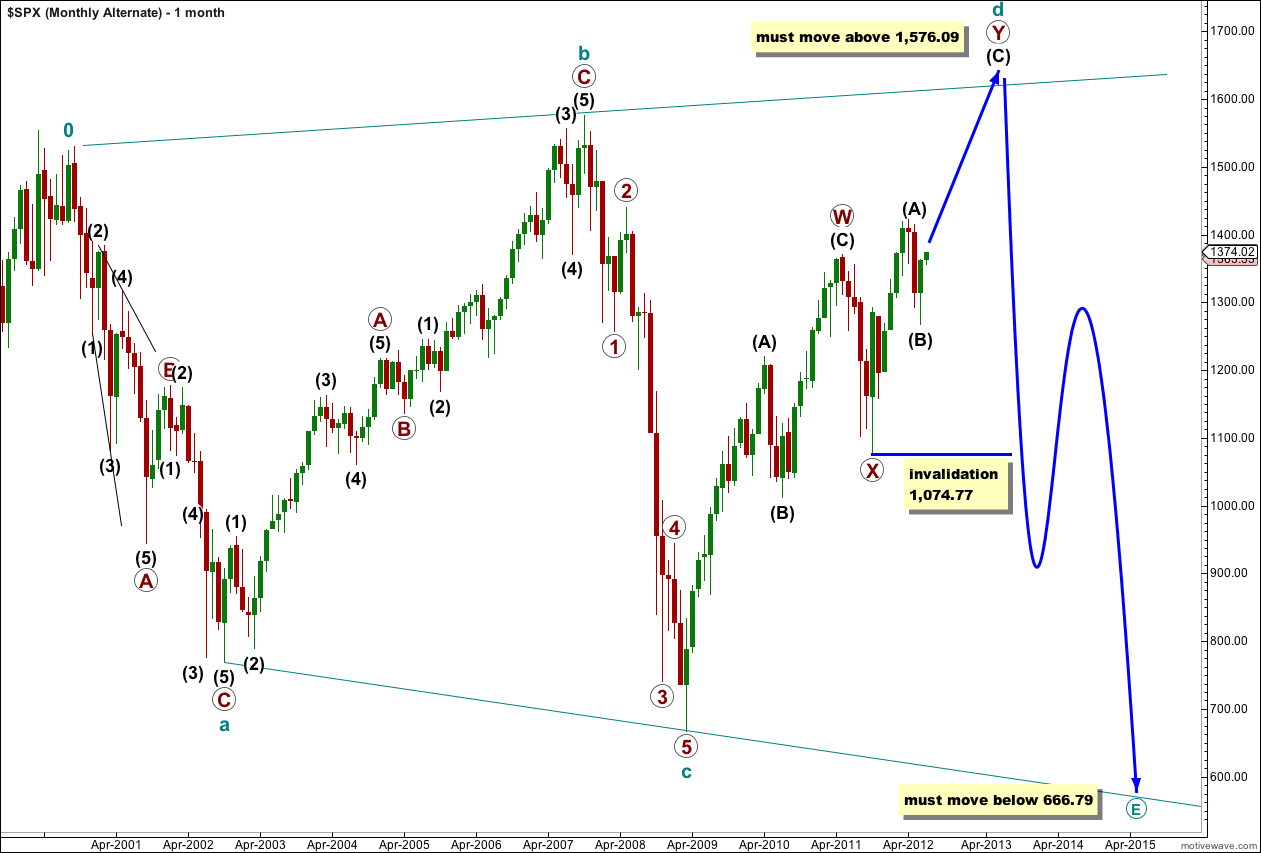
It is possible that an expanding triangle is unfolding at supercycle degree in a fourth wave position.
An expanding triangle requires each of subwaves c, d and e to move beyond the end of the same directional subwave. Thus, cycle wave d must make a new high above the end of cycle wave b at 1,576.09 and cycle wave e downwards to follow it must make a new low below the end of cycle wave c at 666.79.
Four of the five waves of a triangle should subdivide into zigzags or double zigzags and one subwave may be an impulse. Cycle wave c looks most like an impulse.
If intermediate wave (B) is not over and continues lower it may not move beyond the start of intermediate wave (A). This wave count is invalidated in the mid term with movement below 1,074.77.
This wave count has a very low probability for the following reasons:
-
1. expanding triangles are extremely rare structures. In over 5 years of daily analysis I have seen only two or three, and the rarity of this structure significantly reduces the probability of this wave count being correct.
2. The structure labeled wave a-b-c at cycle degree looks very strongly like a flat correction. To see this as part of a continuing triangle looks very unlikely.
3. Although one subwave within a triangle may be an impulse, for it to be cycle wave c here does not look right as the more common impulse within a triangle is wave a.
One of the subwaves of a triangle should be a longer lasting more complicated correction, a double zigzag. Cycle wave d is probably doing that here subdividing as a double zigzag with primary waves W and X complete. Primary wave Y should subdivide as a zigzag. The daily chart below for this wave count shows the breakdown of intermediate (black) waves (A), (B) and now (C) within primary wave Y zigzag.
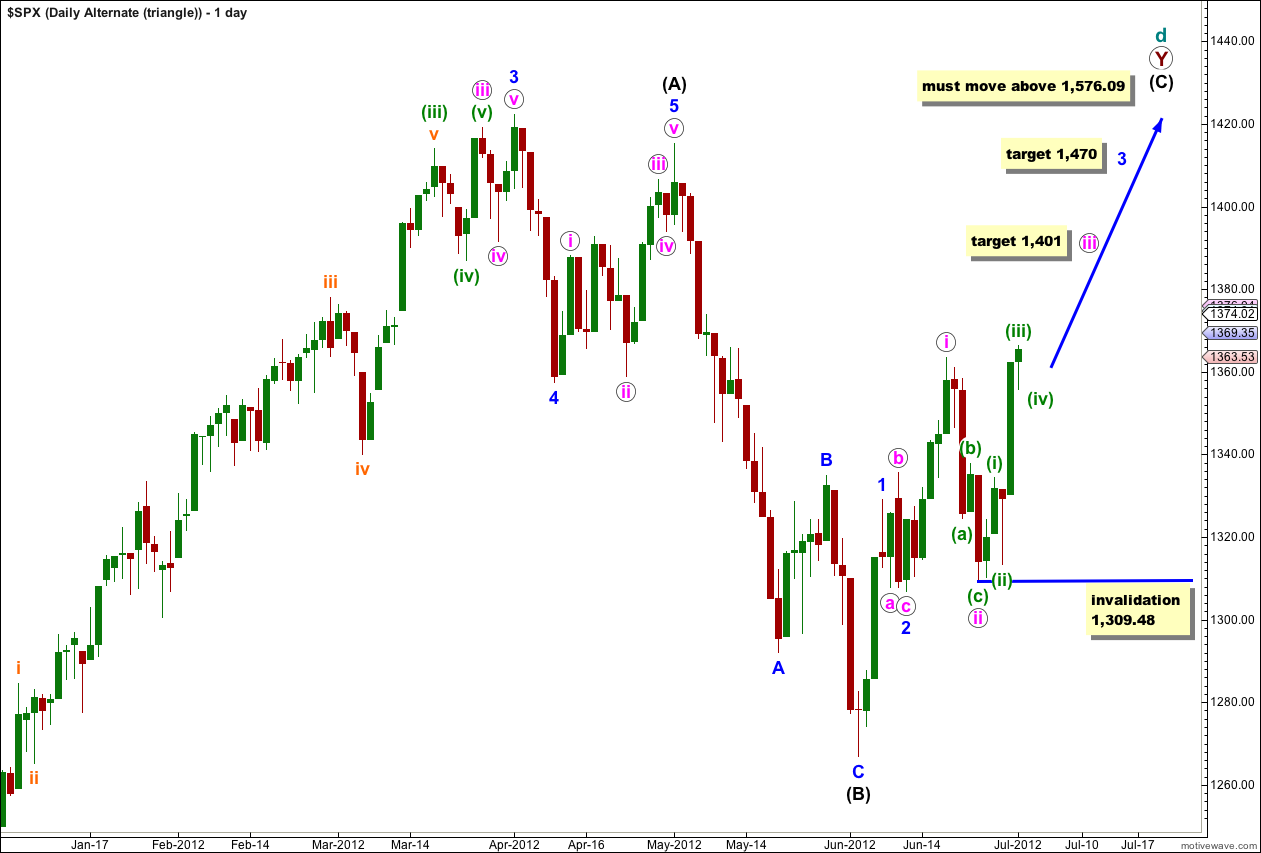
If an intermediate wave (C) is unfolding to the upside then it is most likely subdividing as a simple impulse.
This alternate wave count would expect upwards momentum to increase as the middle of a third wave unfolds.
At 1,401 wave iii pink would reach 1.618 the length of wave i pink.
At 1,470 wave 3 blue would reach 2.618 the length of wave 1 blue.
Primary wave Y must take price a little above 1,576.09.
Within wave iii pink no second wave correction may move beyond the start of the first wave. This wave count is invalidated with movement below 1,309.48.
We might need to ink out a new triangle to tell us which way to go.
Ok. Karen, thanks.
We have to play it tight in this area … with the NYMO over 100 this could be the top of an ABC Wave of (2) ES 1370 KEY.
Francis … we use Unorthodox Wave Analysis and aspects of the original works of R.N. Elliott’s Elliott Wave Principle
Karen, what is Wave Theory? Some website?
Wave Theory shows us the target of 1434.44 on 8/3/2012 with a MAX height 1497 on 9/18/2012 (capitulation) before we drop with a target under 1150.00.
Thank you for taking time to comment on the count, I can learn so much from what you have just shared.
For your alternate count
For pt no 3. someone in another forum did a count for wave C, instead of labeling it as an impulse, he labelled it as an ending diagonal.
In your opinion, could that work also?
http://www.deepwaveanalytics.com/forums/attachment.php?aid=843
that wave count is invalid. within an ending diagonal ALL the subwaves must be zigzags (page 88 “Elliott Wave Principle” by Frost and Prechter). that wave count has a triple zigzag. if an ending diagonal was allowed to have double or triple zigzags then the rules would state that, but they don’t.
furthermore, even if an ending diagonal could have a triple zigzag those structures are exceedingly rare which makes it at the very least extremely unlikely.
they’re trying to see a five as a three. it looks wrong.
btw thank you for providing a link.
it makes it so much easier to comment on a wave count when I can see it.
Thanks.
Thank you for your alternate wave count.
Really appreciate your open mindedness.