
Movement above 1,361.01 has invalidated the main hourly wave count.
I still have two daily wave counts. The price point which differentiates the two wave counts is very close by. We should know early on Monday morning which wave count is correct.
Click on the charts below to enlarge.
Main Wave Count.
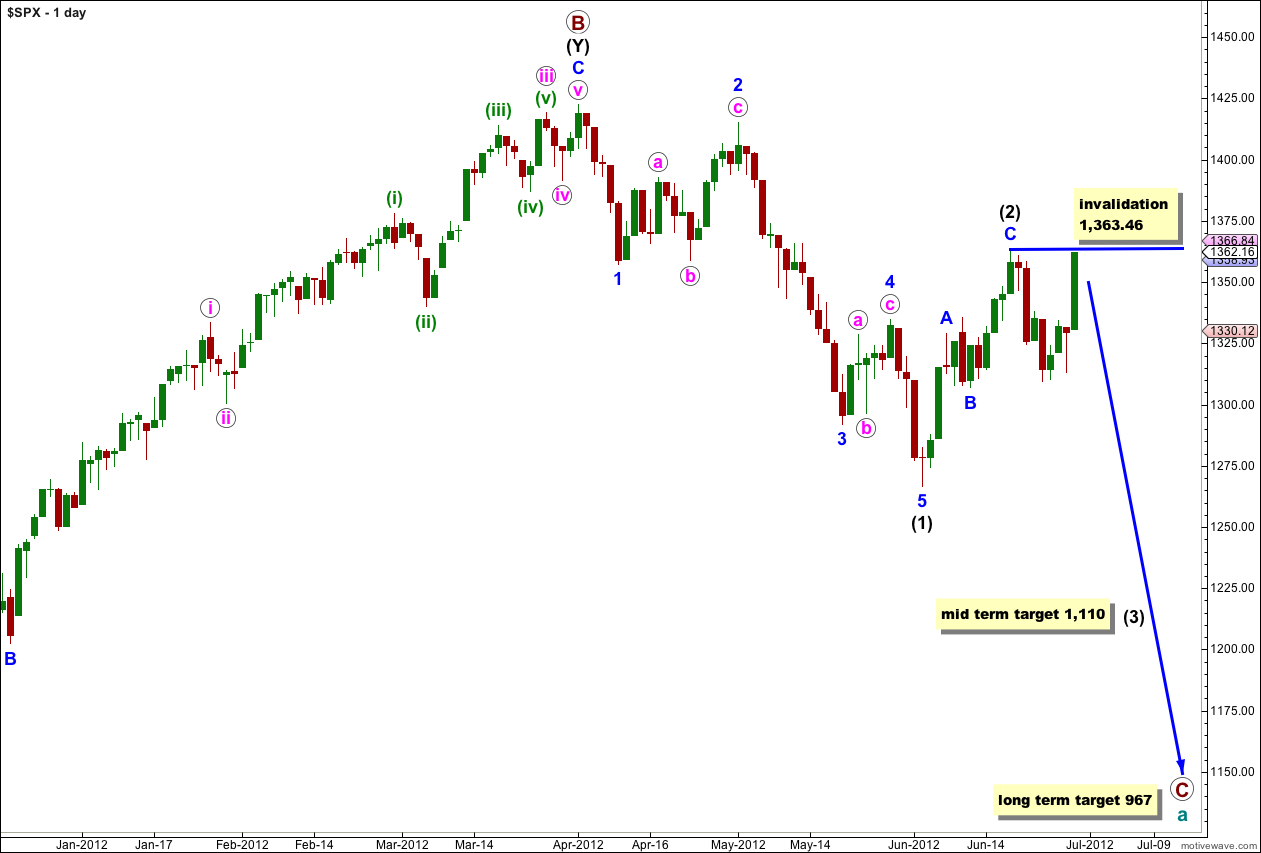
This wave count sees a big trend change at the price high of 1,422.38. Primary wave C should make substantial new lows below the end of primary wave A which had its low at 1,074.77. Primary wave C would reach 1.618 the length of primary wave A at 967, completing a typical expanded flat for cycle wave a.
At this stage the zigzag labeled wave (2) black is still probably complete. At 1,110 wave (3) black would reach 1.618 the length of wave (1) black.
At this stage the only variable is whether or not wave (2) black will be a single zigzag structure or may continue further as a double. The alternate looks at this possibility. However, with a clear five down on the hourly chart the alternate possibility is less likely. This main wave count has a very good probability that we are now within a third wave at intermediate degree.
Within wave (3) black no second wave correction may move beyond the start of its first wave. This wave count is invalidated with movement above 1,363.46. It looks like wave (2) black ended at the price high at 1,363.46 and did not have a truncated fifth wave.
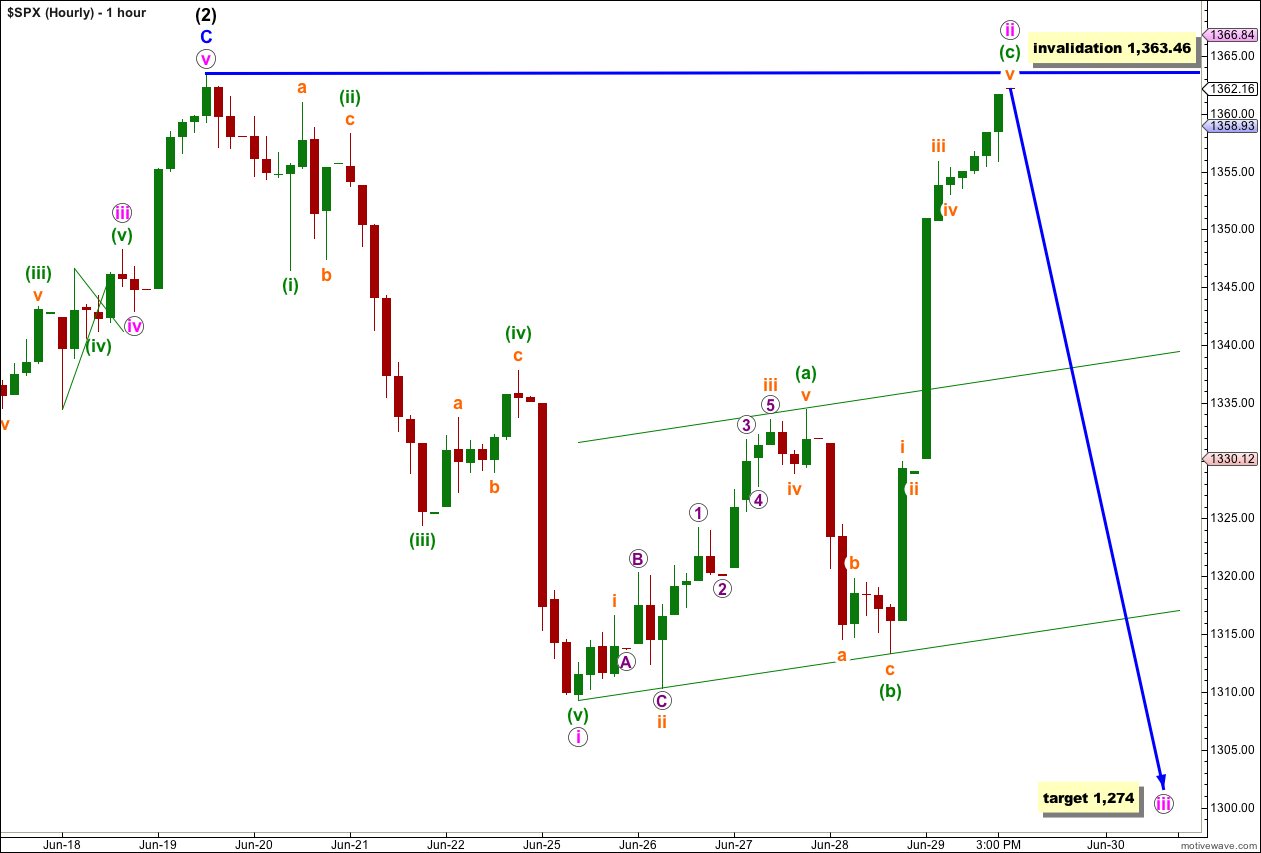
With price moving above 1,361.01 but remaining just below 1,363.46 it looks like wave (2) black ended at the price high and not with a truncated fifth wave. This means wave iv pink at the end of it is disproportionate to wave ii pink.
Downwards movement for wave i pink is in a clear five wave structure while upwards movement (so far) for wave ii pink is in a clear three wave structure. Although Friday’s upwards movement was very strong it is significant that price has failed to make a new high beyond 1,363.46. If this price high holds then this structure will look like a typical deep second wave correction.
Within wave ii pink there is no Fibonacci ratio between waves (a) and (c) green.
Ratios within wave (c) green are: wave iii orange is 0.98 points short of 1.618 the length of wave i orange, and wave v orange is 0.83 points short of 0.618 the length of wave i orange. With excellent Fibonacci ratios within this impulse it would be likely that it was over at the end of Friday’s session.
At 1,274 wave iii pink would reach 1.618 the length of wave i pink.
Looking at this structure on the daily chart it may also be possible to move everything up one degree. It is possible that we may be seeing waves 1 and 2 blue complete within wave (3) black. If the next wave down is very extended, passing the target at 1,274, then I may move everything up one degree.
Any further upwards movement above 1,363.46 would invalidate this wave count. Wave ii pink may not move beyond the start of wave i pink.
Alternate Wave Count.
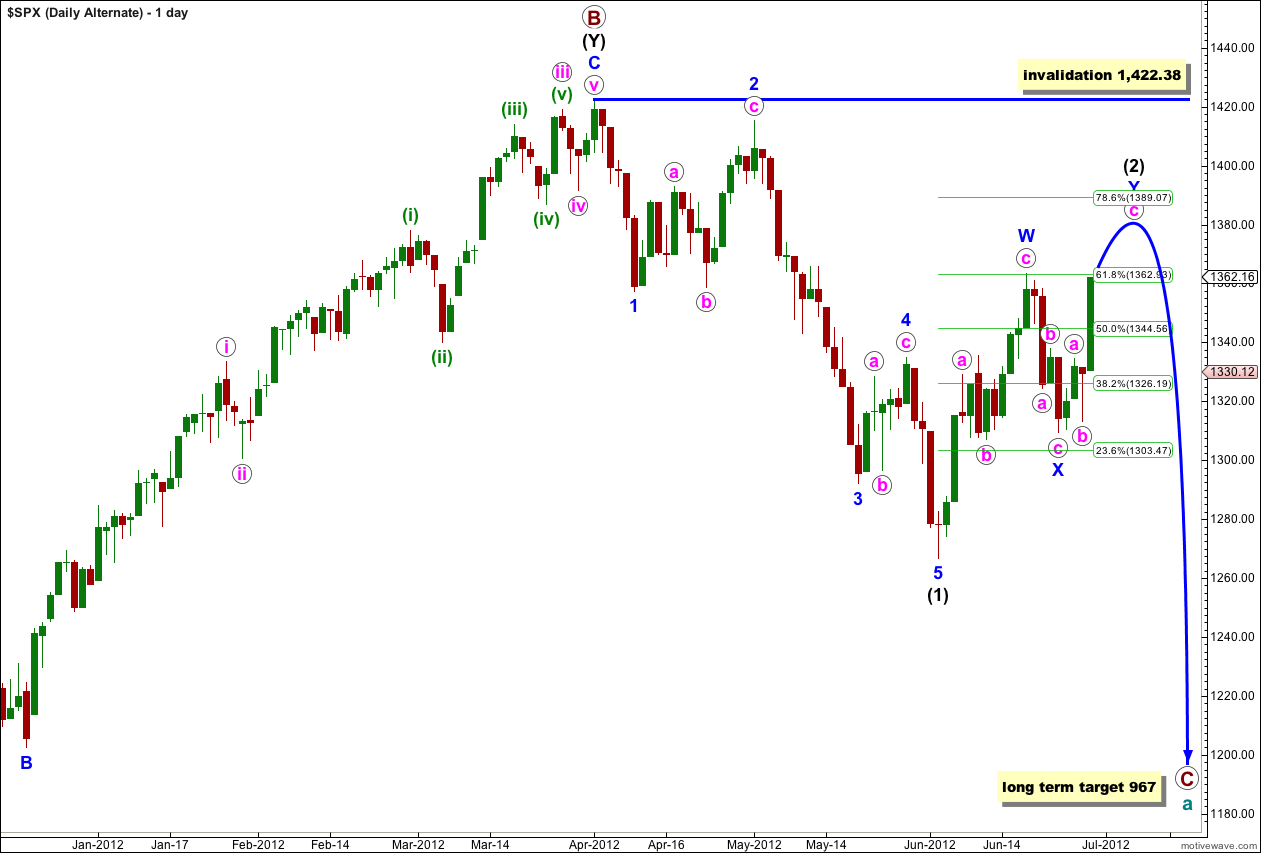
This alternate wave count is identical to the main wave count with the sole exception of looking at wave (2) black as a double rather than a single.
Wave X blue would most likely be complete at this stage. Upwards movement would most likely be a second zigzag for wave Y blue.
Wave W blue was a zigzag and if wave Y blue is also a zigzag then wave (2) black is a double zigzag. The purpose of double zigzags is to deepen a correction and we should expect further upwards movement.
Wave (2) black may not move beyond the start of wave (1) black. This wave count is invalidated with movement above 1,422.38.
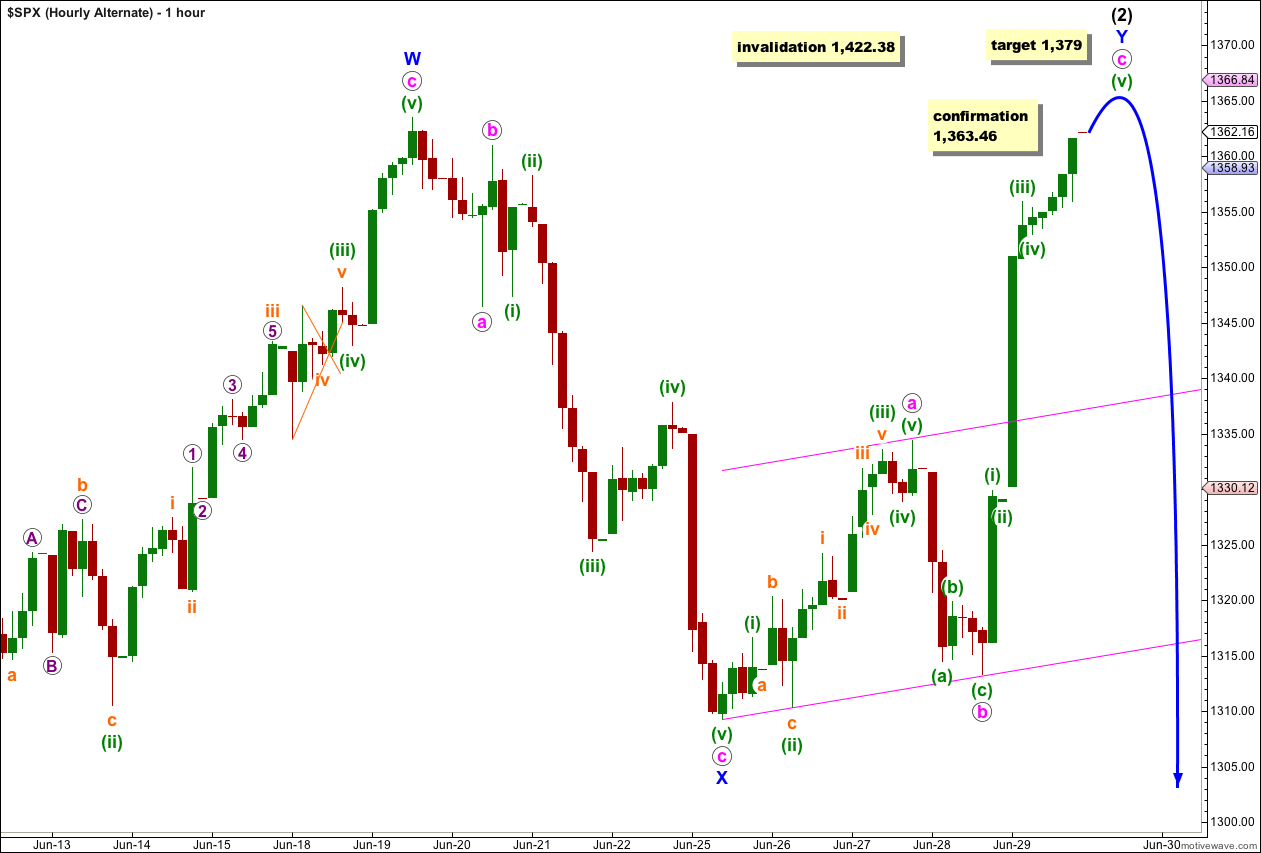
By simply counting the movement from the end of wave a pink to the end of wave (ii) green within c pink as two corrections rather than one we can see a corrective wave count within wave X blue. This could be a complete zigzag. The difference in this hourly wave count from the main wave count is the subdivision of the small downwards wave labeled (i) green within c pink; this alternate must see it as an impulse whereas the main wave count must see it as a zigzag. On the 5 minute chart it subdivides more easily as an impulse which favours this alternate wave count.
If price moves above 1,363.46 the main wave count would be invalidated and this alternate confirmed. If this alternate is correct then it should be confirmed early in Monday’s session.
At 1,379 wave c pink would reach 2.618 the length of wave a pink.
Wave (2) black may not move beyond the start of wave (1) black. This wave count is invalidated with movement above 1,422.38.
Hi Michael,
So you work for barchart.com?
Got your email recently for the service check.
Francis
wrong person. check for virus. mjo
Observation: McClellan Oscillator diverged on Friday close. It is also well into overbought zone.