
Yesterday’s analysis expected the S&P 500 to trend downwards for Thursday’s session. We have seen a new low and the market has behaved as expected.
I still have two daily wave counts for you today which both expect the same direction next. For the main wave count I have two hourly wave counts today, with the second having a low probability. It should only be used if it is confirmed.
Click on the charts below to enlarge.
Main Wave Count.
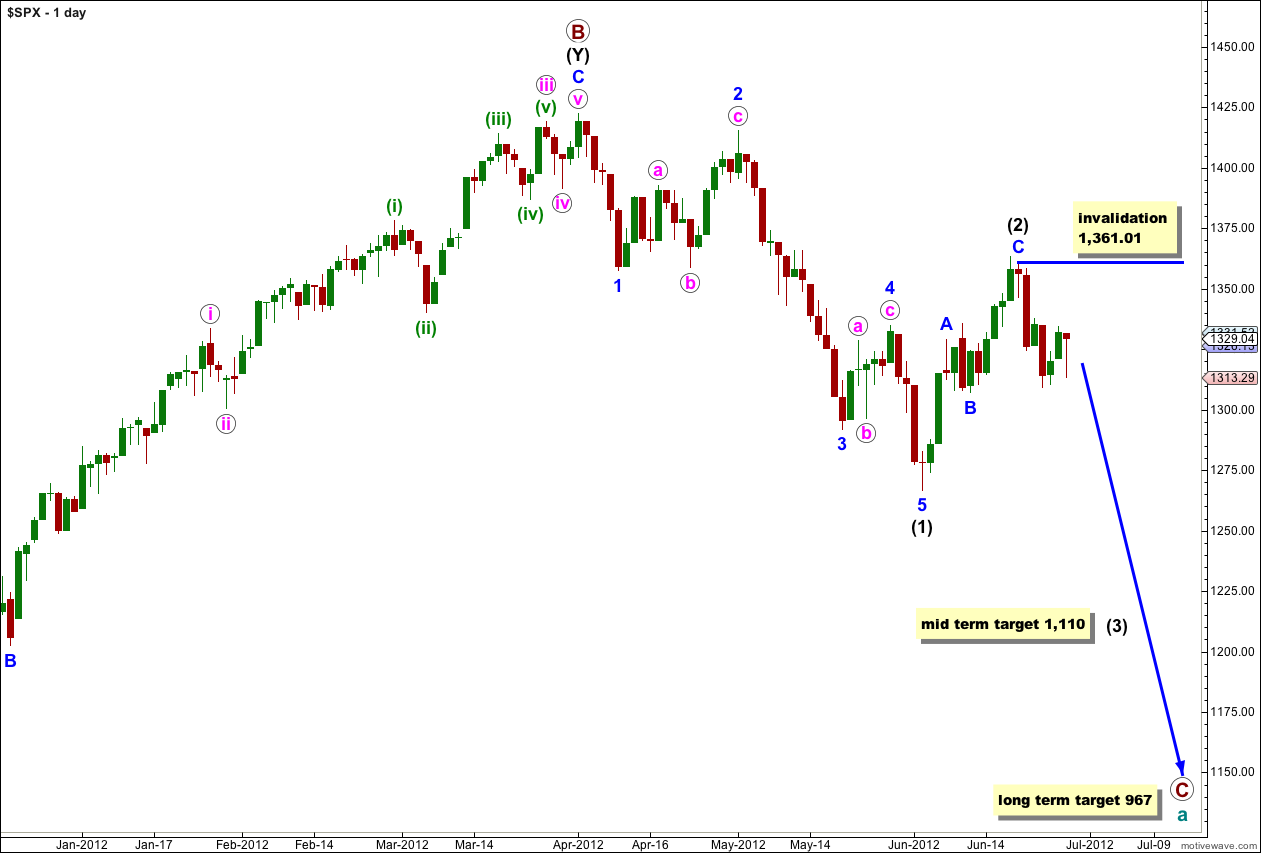
This wave count sees a big trend change at the price high of 1,422.38. Primary wave C should make substantial new lows below the end of primary wave A which had its low at 1,074.77. Primary wave C would reach 1.618 the length of primary wave A at 967, completing a typical expanded flat for cycle wave a.
At this stage the zigzag labeled wave (2) black is probably complete. At 1,110 wave (3) black would reach 1.618 the length of wave (1) black.
At this stage the only variable is whether or not wave (2) black will be a single zigzag structure or may continue further as a double. The alternate looks at this possibility. However, with a clear five down on the hourly chart the alternate possibility is less likely. This main wave count has a very good probability that we are now within a third wave at intermediate degree.
Within wave (3) black no second wave correction may move beyond the start of its first wave. This wave count is invalidated with movement above 1,361.01.
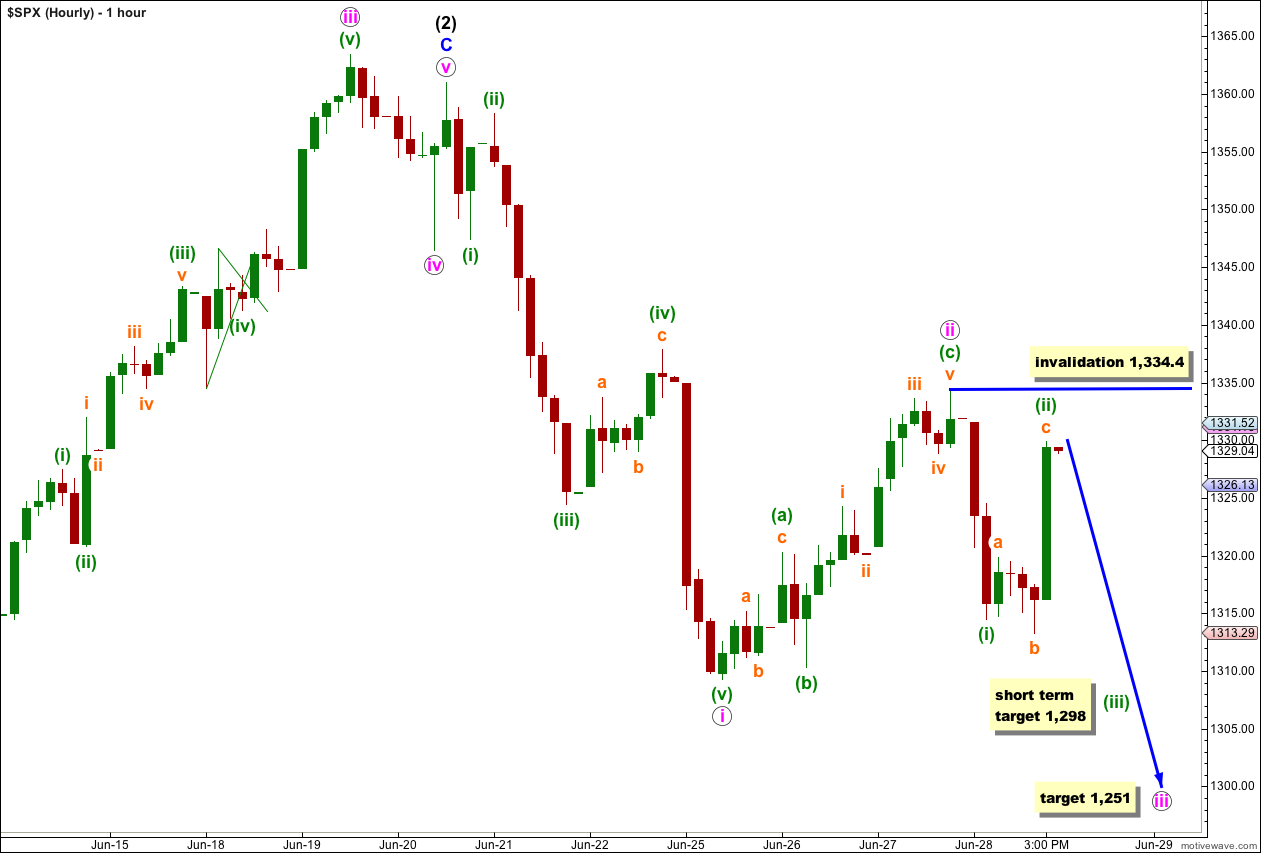
Thursday’s session began exactly as expected with strong downwards movement. However, to end the session most of this downwards movement was retraced. The key to seeing whether or not this movement is the start of a third wave is the structure of wave b orange within (ii) green.
On the 5 minute chart wave (i) green subdivides easily into a clear five wave impulse. Within wave (ii) green waves a and b orange subdivide most easily into three wave movements which fits the requirements for a flat correction. Wave c orange subdivides into a complete five wave impulse. Wave c orange has no Fibonacci ratio to wave a orange. I expect wave (ii) green is an expanded flat correction.
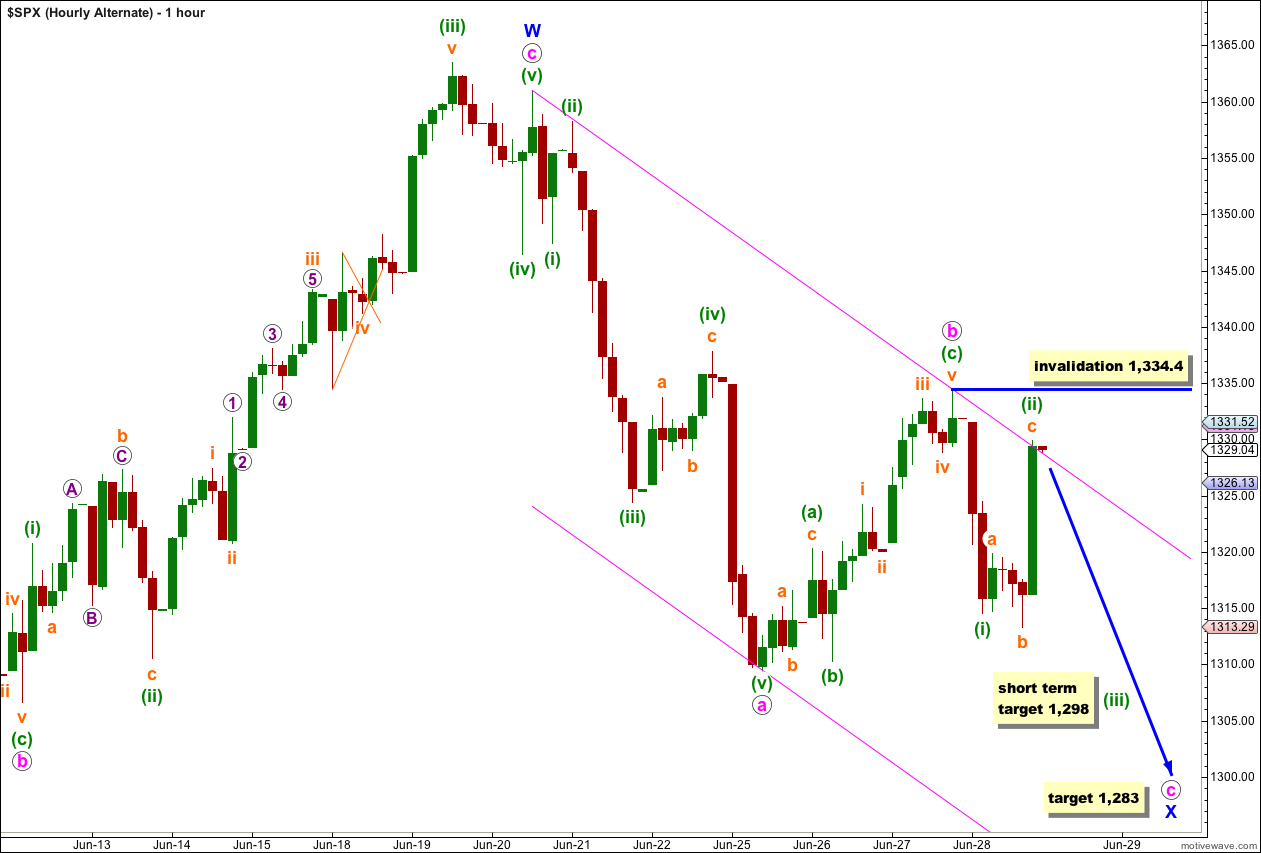
If wave (ii) green does not move any higher then at 1,298 wave (iii) green would reach 1.618 the length of wave (i) green. This short term target should be met within another couple of sessions, and it depends on the length of extensions and the duration of corrections within this third wave.
At 1,251 wave iii pink would reach 1.618 the length of wave i pink. This mid term target is at least a few days away.
Wave (ii) green may not move beyond the start of wave (i) green. This wave count is invalidated with movement above 1,334.4.
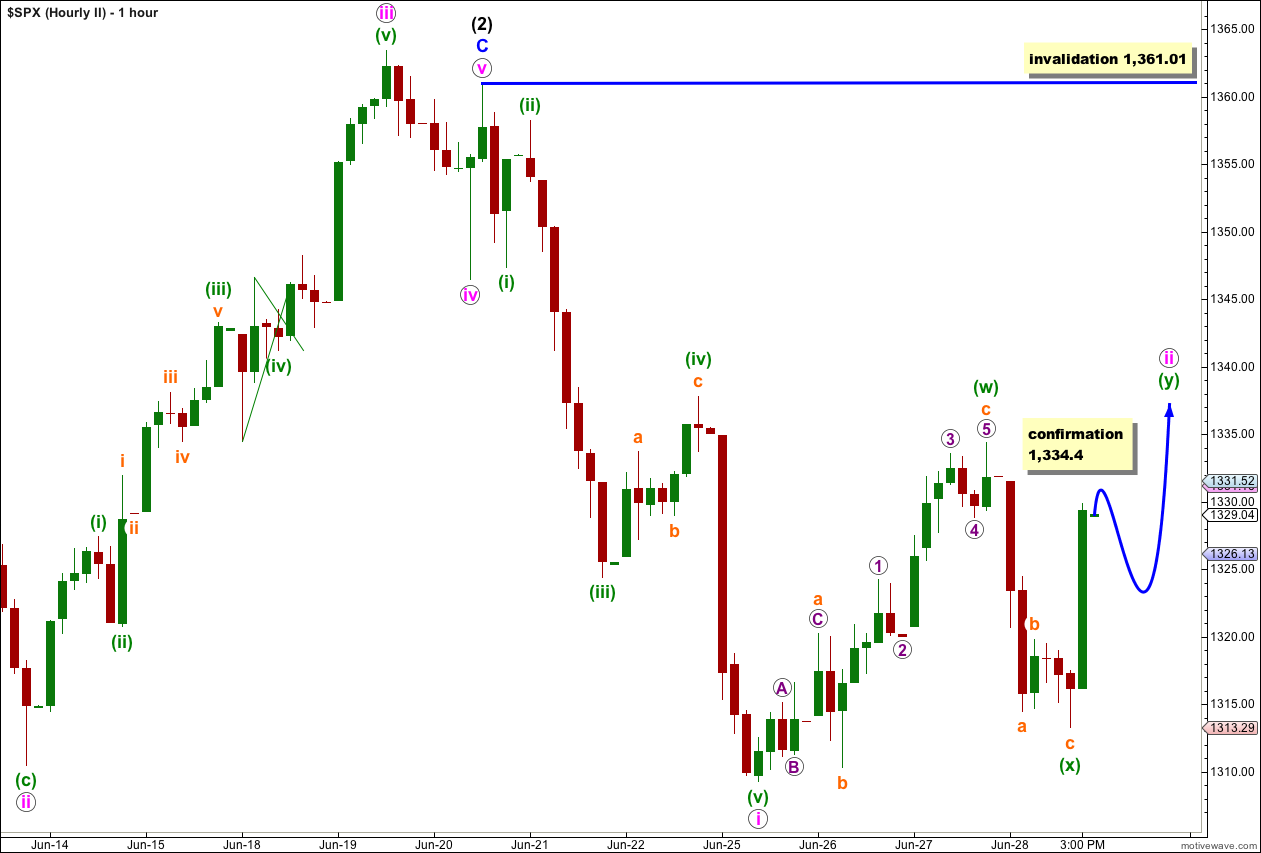
This wave count has a low probability because the subdivisions within the small wave labeled here c orange within (x) green do not fit well. This second wave count must see this movement as a five wave structure and on the 5 minute chart it has a corrective count of 7. It may possibly be a slightly odd looking ending diagonal though and so I will consider this possibility. However, this wave count should only be used if it is confirmed with price movement above 1,334.4.
It is just possible that wave ii pink is not over and may be continuing further as a double flat or double combination. If that is the case then downwards movement for Thursday’s session may be seen as a three wave zigzag labeled wave (x) green, a three joining the two structures of a double.
Wave (y) green should take about two or three days to unfold. The purpose of double flats and double combinations is to move price sideways and take up time, and I would not be expecting wave (y) green to end substantially above the high labeled (w) green but rather to end slightly above this point. Wave (y) green may unfold as a zigzag, flat or triangle. It should take price sideways in choppy overlapping movement.
Wave ii pink may not move beyond the start of wave i pink. This wave count is invalidated with movement above 1,361.01.
Alternate Wave Count.
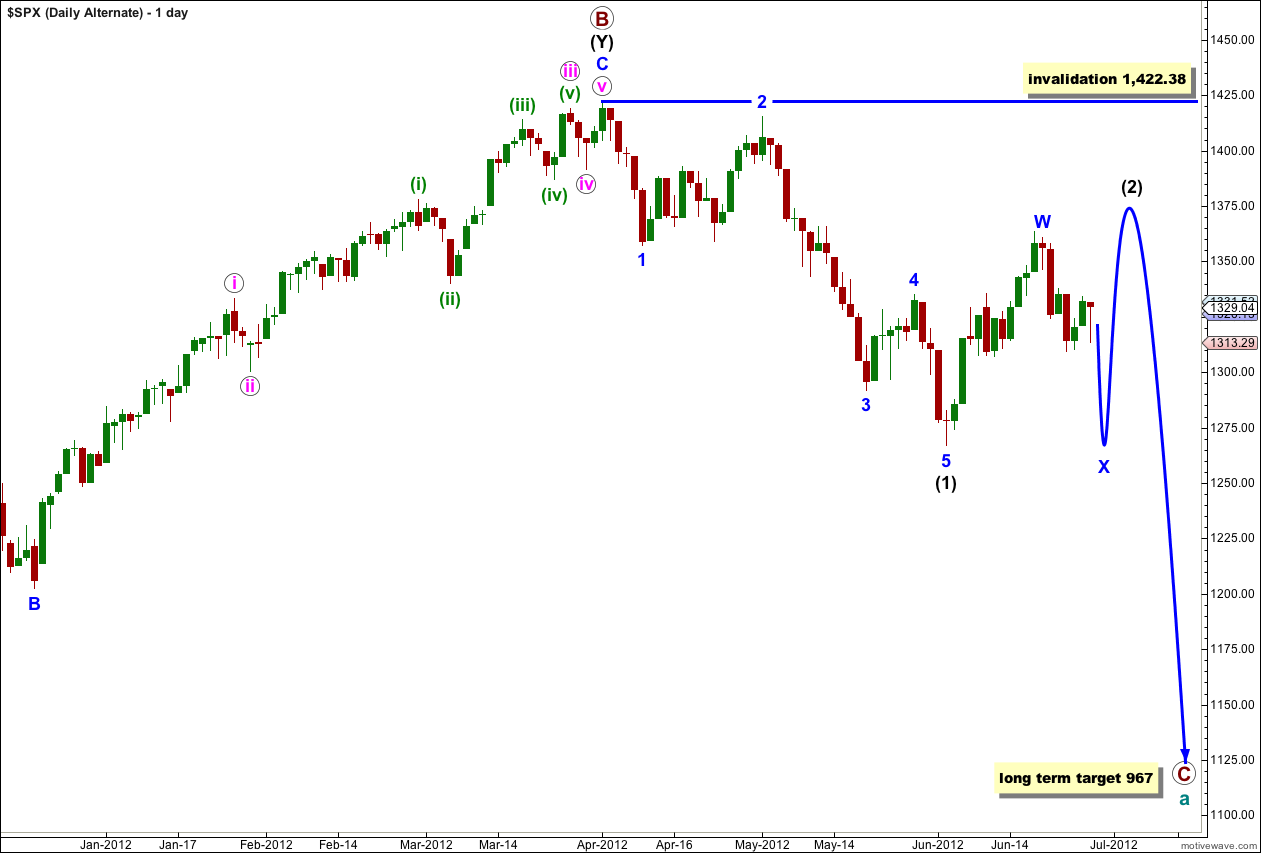
This alternate wave count is identical to the main wave count with the sole exception of looking at wave (2) black as a double rather than a single.
If this wave count is correct then the next movement would be downwards in a three wave structure for an X wave. This is most likely to be a zigzag. So far waves a and b pink within a possible zigzag may be complete.
Wave X blue may make a new low below the start of wave W blue, but it is unlikely to. There can be no downwards invalidation point for this reason. We will have to pay close attention to structure to indicate which of our two wave counts is correct.
The subdivisions for this alternate are the same as for the main wave count.
At 1,298 wave (iii) green would reach 1.618 the length of wave (i) green.
At 1,283 wave c pink would reach equality in length with wave a pink.
Wave (ii) green has come up to the upper edge of the parallel channel drawn here about this correction using Elliott’s technique. This trend line may provide resistance to upwards movement when markets open tomorrow, initiating the third wave down.
Wave (ii) green may not move beyond the start of wave (i) green. This wave count is invalidated with movement above 1,334.4.
Yup, here you go .. http://elliottwavestockmarket.com/2012/06/16/sp-500-elliott-wave-technical-analysis-15th-june-2012/#comment-1991
Which charts are you referring to with these wave counts and targets Karen?
It could be just a moot point that SPX did not pop over 1363.46 today — Monday’s gap up should fix that I would think.
” …. risk-on phase that lifts the S&P – possibly climbing the wall of worry back up to the 1400s by late July or early August. ” http://www.zerohedge.com/news/bob-janjuah-sp-trek-1400-1000-800
Looks like Wave iii of 3 going into 1377.00
Hi Lara
Since we will probably open above the invalidation point on the main hrly, do we have a target for the y wave – eg =ity with w is mid 1340s, 1.618 X= ??.
Yes, after looking at what the EURUSD has done we probably will gap open higher!
Until we have a and b within (y) I cannot calculate a target for it to end. At this stage a is probably incomplete that’s why I didn’t label it as complete.
The only thing I can say is the purpose of double flats and double combinations is to move price sideways. If we gap open higher and this is a double then it should move price sideways so I would expect slight new highs but not significant new highs.
Hi Lara,
For your main hourly count
the wave pink ii, which you have labelled, could it be just wave a of a lower degree?
and the rally back up means that the market is starting wave c and then wave ii pink would end up higher around 1360?
Thanks
Yes, that is certainly another very valid wave count. If we simply move the labeling within ii pink down one degree it may have had an expanded flat for wave a within it, so we would need b down (which must reach at least 90% of a because a is a three) then c upwards.
as for where c ends up, that would depend on how low b goes.
if b ends between 90% and 104% of a then we should expect c to end not too far beyond the end of a for a regular flat (sideways movement overall)
but if b ends 105% of a then c would most likely be 1.618 the length of a for an expanded flat so we should expect more upwards movement.