
Yesterday’s analysis expected choppy overlapping upwards movement to either last for some or all of Wednesday’s session. Price has behaved as expected and remains very slightly below the invalidation point, with the upwards movement lasting for all of Wednesday’s session.
I still have two wave counts and the both expect exactly the same direction next.
Click on the charts below to enlarge.
Main Wave Count.
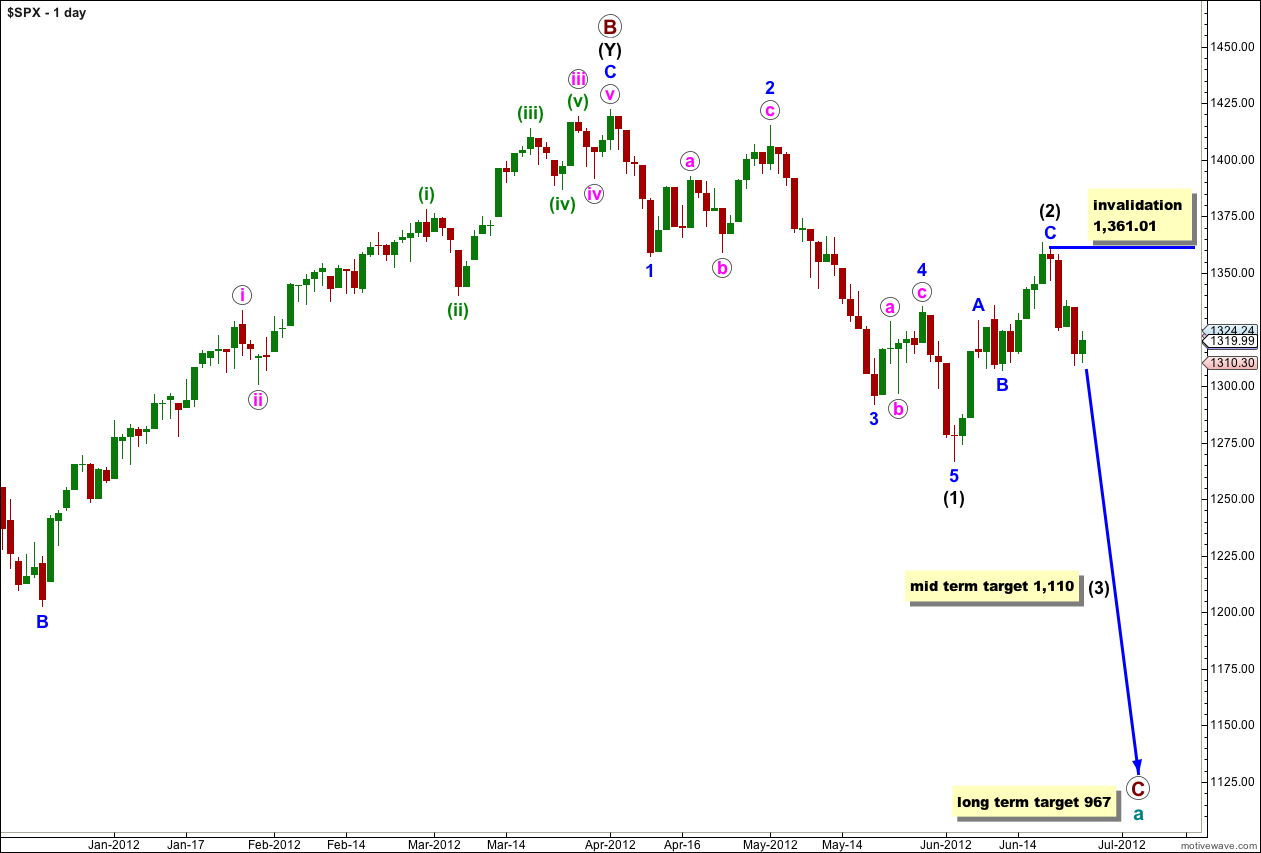
This wave count sees a big trend change at the price high of 1,422.38. Primary wave C should make substantial new lows below the end of primary wave A which had its low at 1,074.77. Primary wave C would reach 1.618 the length of primary wave A at 967, completing a typical expanded flat for cycle wave a.
At this stage the zigzag labeled wave (2) black is probably complete. At 1,110 wave (3) black would reach 1.618 the length of wave (1) black.
At this stage the only variable is whether or not wave (2) black will be a single zigzag structure or may continue further as a double. The alternate looks at this possibility. However, with a clear five down on the hourly chart the alternate possibility is less likely. This main wave count has a very good probability that we are now within a third wave at intermediate degree.
Within wave (3) black no second wave correction may move beyond the start of its first wave. This wave count is invalidated with movement above 1,361.01.
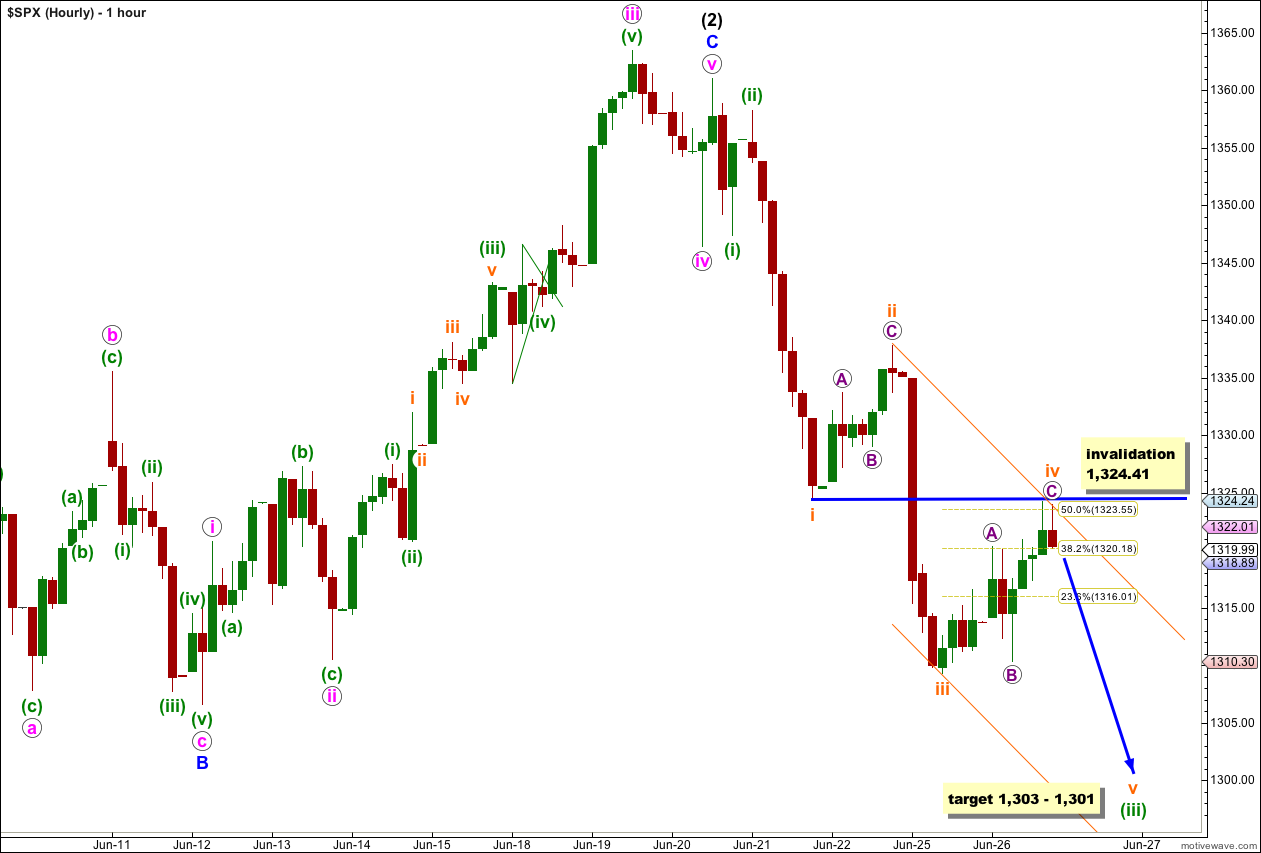
Upwards movement for wave iv orange has completed a flat correction. We have nice alternation between wave ii orange as a shallow zigzag and wave iv orange as a relatively deep (over 50% but only just) flat correction.
I think it is corroborative that upwards movement of wave iv orange has come very close to the end of wave i orange. Fourth waves often do this, and sometimes they touch the end of first waves perfectly (it is only movement ABOVE the invalidation point which invalidates the wave count, but it need only be a bare fraction of a point). When we see this happen it is a strong indication of a fourth wave. If price does not breach the invalidation point and moves lower tomorrow this wave count will increase significantly in probability.
I have redrawn the parallel channel about wave (iii) green. The first trend line is drawn from the highs of ii to iv orange, a parallel copy is placed upon the low of iii orange. Wave v orange may end midway within this channel.
At 1,303 wave v orange would reach 0.618 the length of wave i orange. At 1,301 wave (iii) green would reach 4.236 the length of wave (i) green. This gives us a 2 point target zone with a good probability.
We should expect downwards movement tomorrow as most likely towards the target. Momentum should be less than the last downwards wave labeled iii orange.
If we see any movement above 1,324.41 tomorrow then we should use the second wave count below. Wave iv orange may not move into wave i orange price territory.
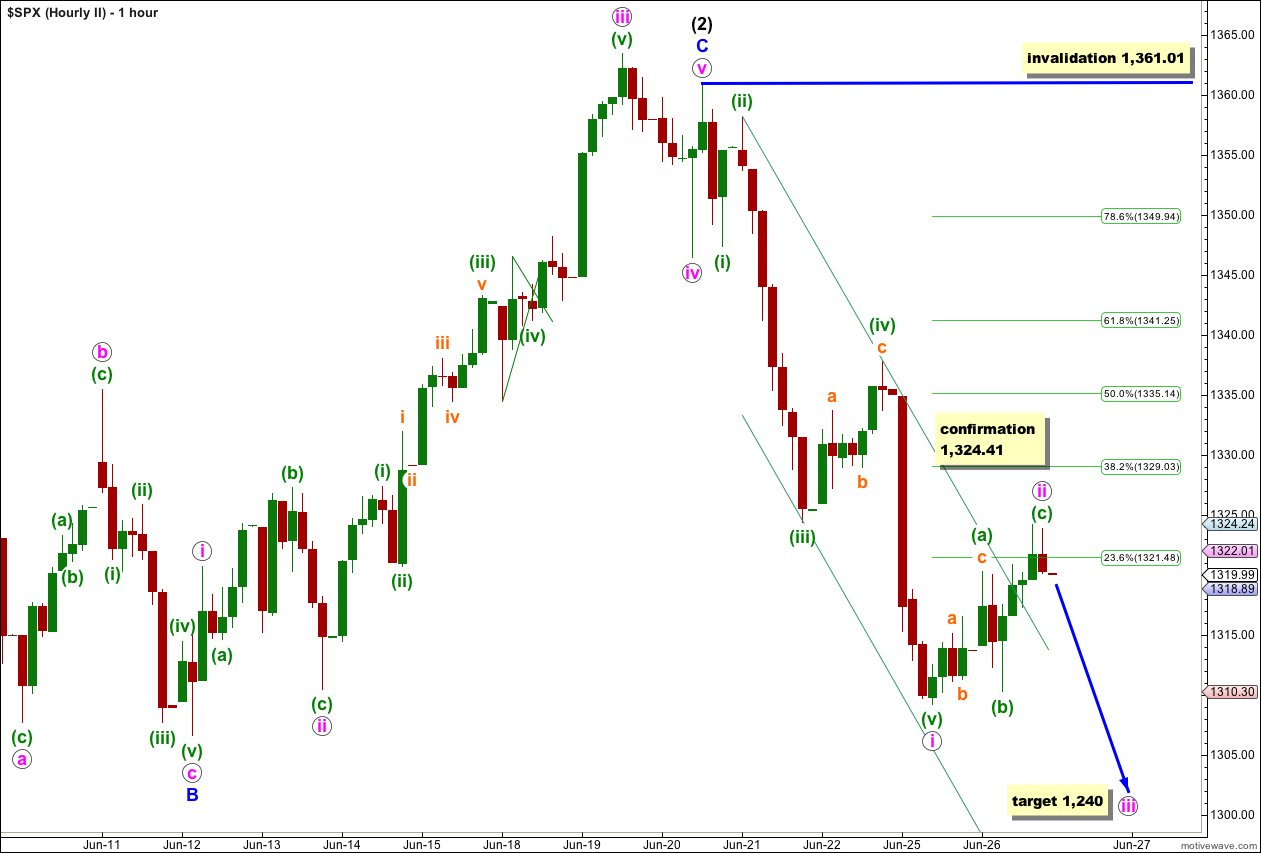
It remains possible that wave i pink is over, although this wave count does not agree with MACD. For that reason it has a low probability and should only be used if it is confirmed with movement above 1,324.41.
If this wave count is correct then wave ii pink may possibly be over (as labeled) or wave (c) green within it may yet continue a little higher.
If wave iii pink has begun at 1,323.94 then it would reach 1.618 the length of wave i pink at 1,240.
I do not consider the shallowness of this second wave correction reason to further reduce the probability of this wave count. Although second waves are more often than not deep corrections we are within a third wave at intermediate degree. The downwards force of a large degree third wave may be enough to reduce upwards corrective movement.
Wave ii pink may not move beyond the start of wave i pink. This wave count is invalidated with movement above 1,361.01.
Alternate Wave Count.
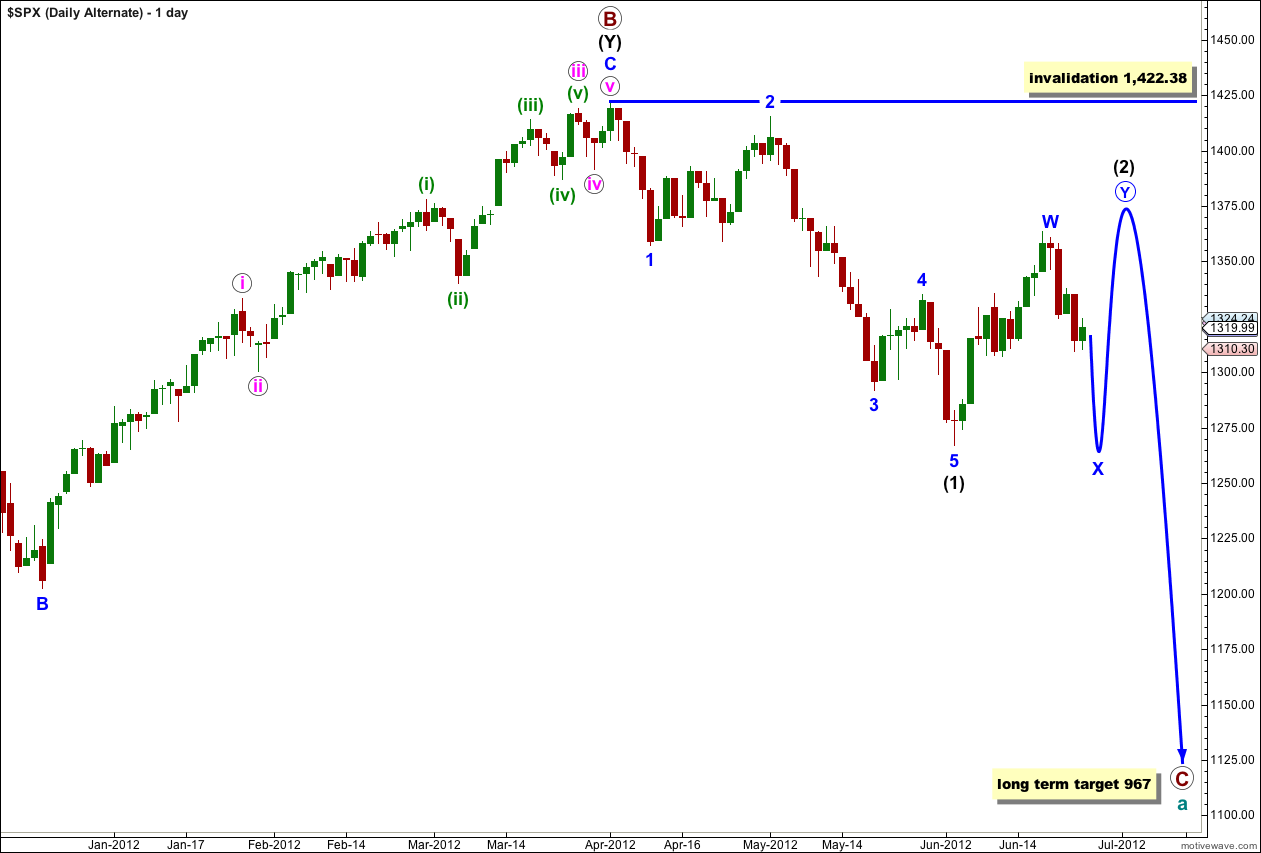
This alternate wave count is identical to the main wave count with the sole exception of looking at wave (2) black as a double rather than a single.
If this wave count is correct then the next movement would be downwards in a three wave structure for an X wave. This is most likely to be a zigzag.
Wave X blue may make a new low below the start of wave W blue, but it is unlikely to. There can be no downwards invalidation point for this reason. We will have to pay close attention to structure to indicate which of our two wave counts is correct.
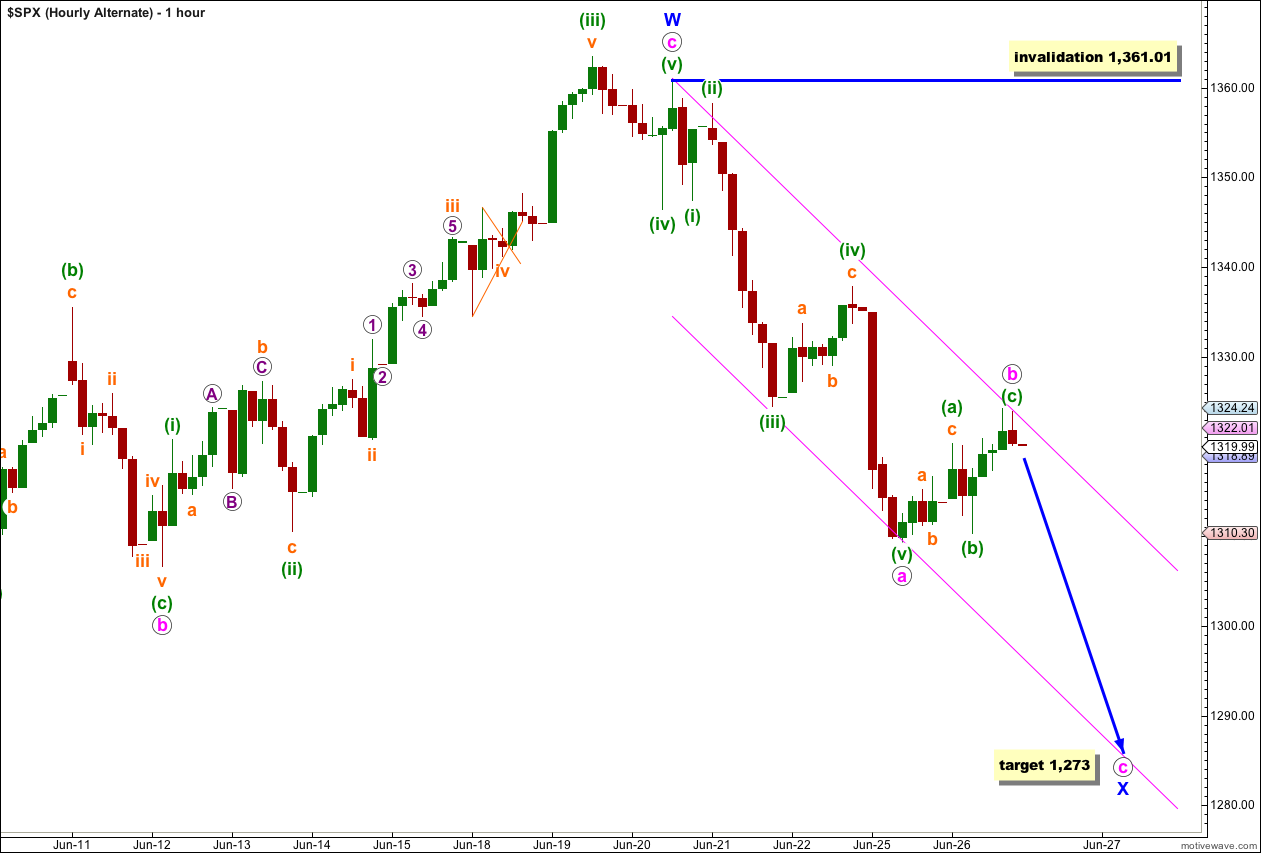
If wave X blue is unfolding as a zigzag then it may need only one more downwards wave to be complete.
At 1,273 wave c pink would reach equality with wave a pink.
This wave count has a low probability because within wave a pink the wave count does not agree with MACD.
We may use Elliott’s technique about a correction to draw a parallel channel about wave X blue zigzag. Wave c pink may end about the lower edge of this channel.
If wave b pink moves any higher it may not move beyond the start of wave a pink. This wave count is invalidated with movement above 1,361.01.
Looks like we could still be in Wave 2 just to put in the top of the right shoulder 1335.52 (left shoulders) … then down big for Wave 3 into 1251 H&S Target.
Hi Lara,
For X blue count, the internals would be 5 waves or 3 waves?
If it is 5 waves down, then there is no difference from the main count, yes?
Nope. The internal structure differs and this is how we can figure out which wave count is correct.
The main count expects an impulse which subdivides as: 5-3-5-3-5
The alternate X wave should be a zigzag which subdivides as: 5-3-5
So as you can see they both start with 5-3-5 but the impulse continues whereas the zigzag is over there.
When we have the first 5-3-5 down complete then if the following correction remains below the wave 1 (the first 5) price territory then it is an impulse. If however price reenters wave 1 territory the downwards movement would be confirmed as an X wave.
This is hard to put into words. Let me know if this is not clear and I will cover it in tomorrow’s video.
Still like the X blue count …
yeah, and I have to say that with the size / duration of yesterday’s correction it looks like a reasonable B wave within a possible zigzag.
I’ve had corrections look like they’re all done and dusted only to turn out to continue as doubles far too many times to not have such an alternate. I’ve learned the hard way to always consider doubles.