
Last analysis expected Monday to begin the week with downwards movement. The target at 1,317 was comfortably passed, but I did expect that the target had only a reasonable probability and that the trend channel would provide stronger guidance as to where downwards movement would end. Price has come close to the lower edge of the parallel channel on the hourly chart.
Mid term targets at intermediate degree and long term targets at primary degree remain the same.
Click on the charts below to enlarge.
Main Wave Count.
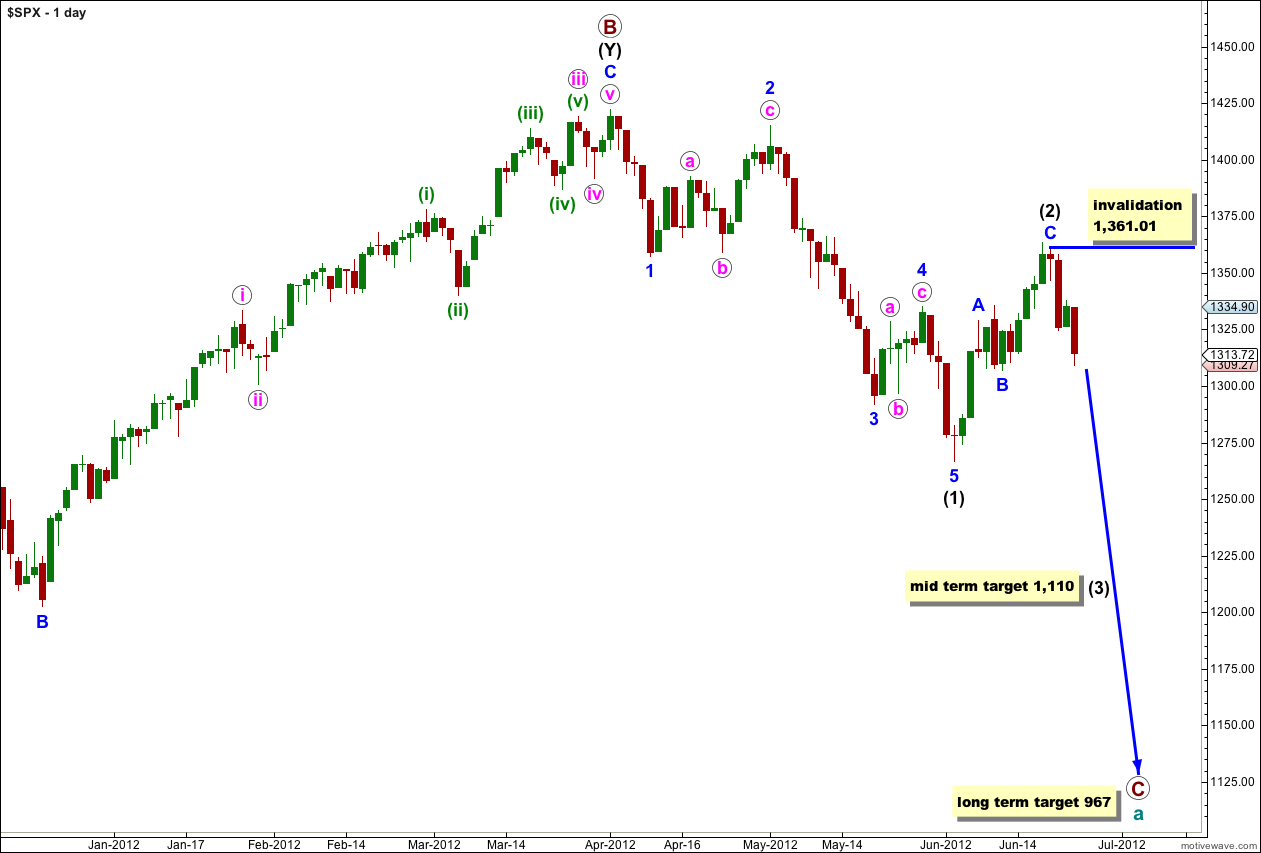
This wave count sees a big trend change at the price high of 1,422.38. Primary wave C should make substantial new lows below the end of primary wave A which had its low at 1,074.77. Primary wave C would reach 1.618 the length of primary wave A at 967, completing a typical expanded flat for cycle wave a.
At this stage the zigzag labeled wave (2) black is probably complete. At 1,110 wave (3) black would reach 1.618 the length of wave (1) black.
At this stage the only variable is whether or not wave (2) black will be a single zigzag structure or may continue further as a double. The alternate looks at this possibility. However, with a clear five down on the hourly chart the alternate possibility is less likely. This main wave count has a very good probability that we are now within a third wave at intermediate degree.
Within wave (3) black no second wave correction may move beyond the start of its first wave. This wave count is invalidated with movement above 1,361.01.
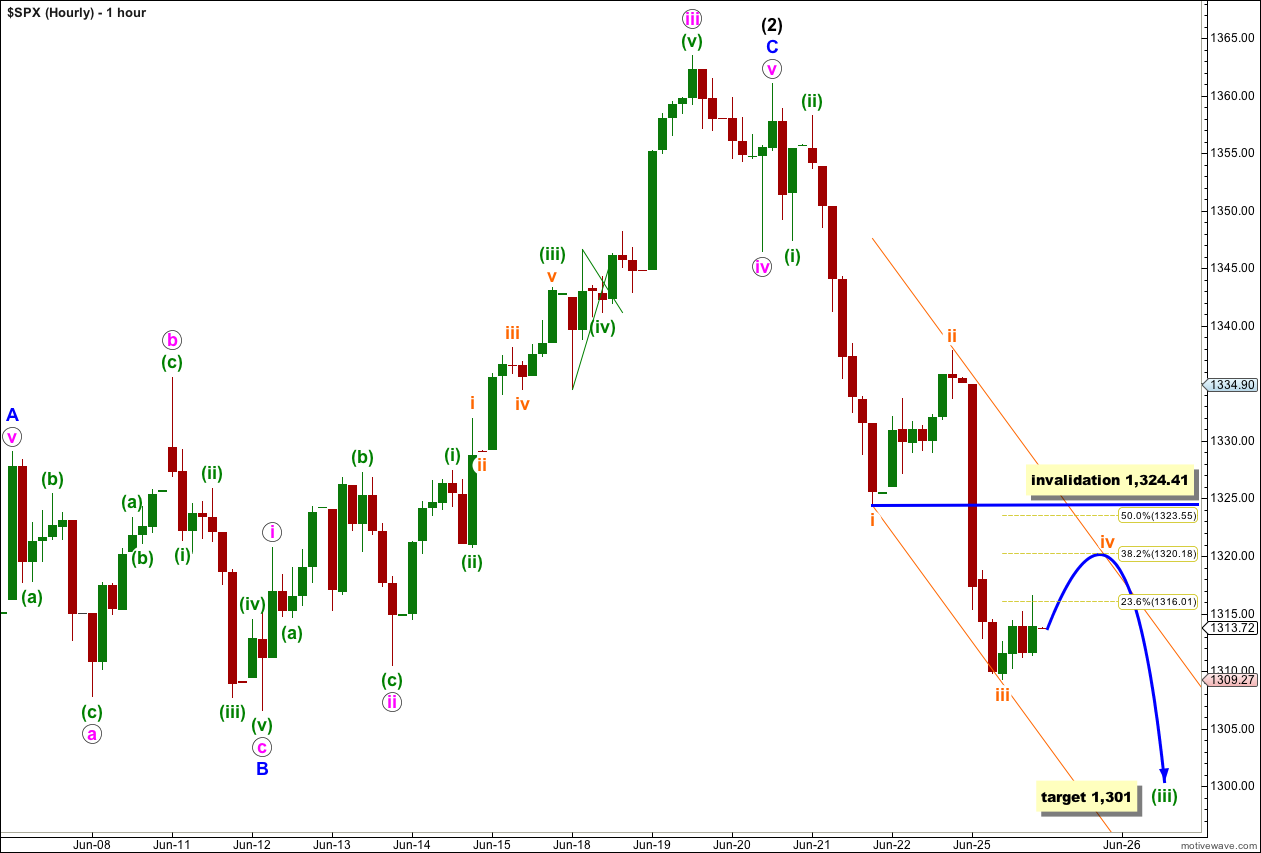
The target for downwards movement was exceeded by 7.73 points. Downwards movement ended close to the lower edge of the parallel channel.
I have adjusted the wave count because the way it was labeled in last analysis does not now agree with MACD. Monday’s downwards movement was very strong and has made a new low on MACD, indicating that the third wave is extending. The downwards wave for Monday’s session looks like the middle of a third wave.
I would expect wave iv orange to end about the 0.382 Fibonacci ratio of wave iii orange at 1,320.18. At this point it should find resistance at the upper edge of the parallel channel drawn using Elliott’s technique about wave (iii) green.
The following fifth wave for wave v orange to end wave (iii) green would most likely end mid way within this channel, and less likely at the lower end of this channel.
There is no Fibonacci ratio between waves i and iii orange so we are more likely to see a Fibonacci ratio between wave v orange and either of i or iii orange. I would expect wave v orange to most likely be about 18 points in length (0.618 the length of wave iii orange). It may not be longer than equality with wave iii orange at 28.55 points in length because wave iii orange is shorter than wave i orange.
At 1,301 wave (iii) green would reach 4.236 the length of wave (i) green. This target will be refined and may change when wave iv orange is over and wave v orange can be calculated.
Wave iv orange may not move into wave i orange price territory. This wave count is invalidated with movement above 1,324.41.
If this wave count is invalidated with upwards movement then the wave count below should be used. It simply follows on directly from the last analysis.
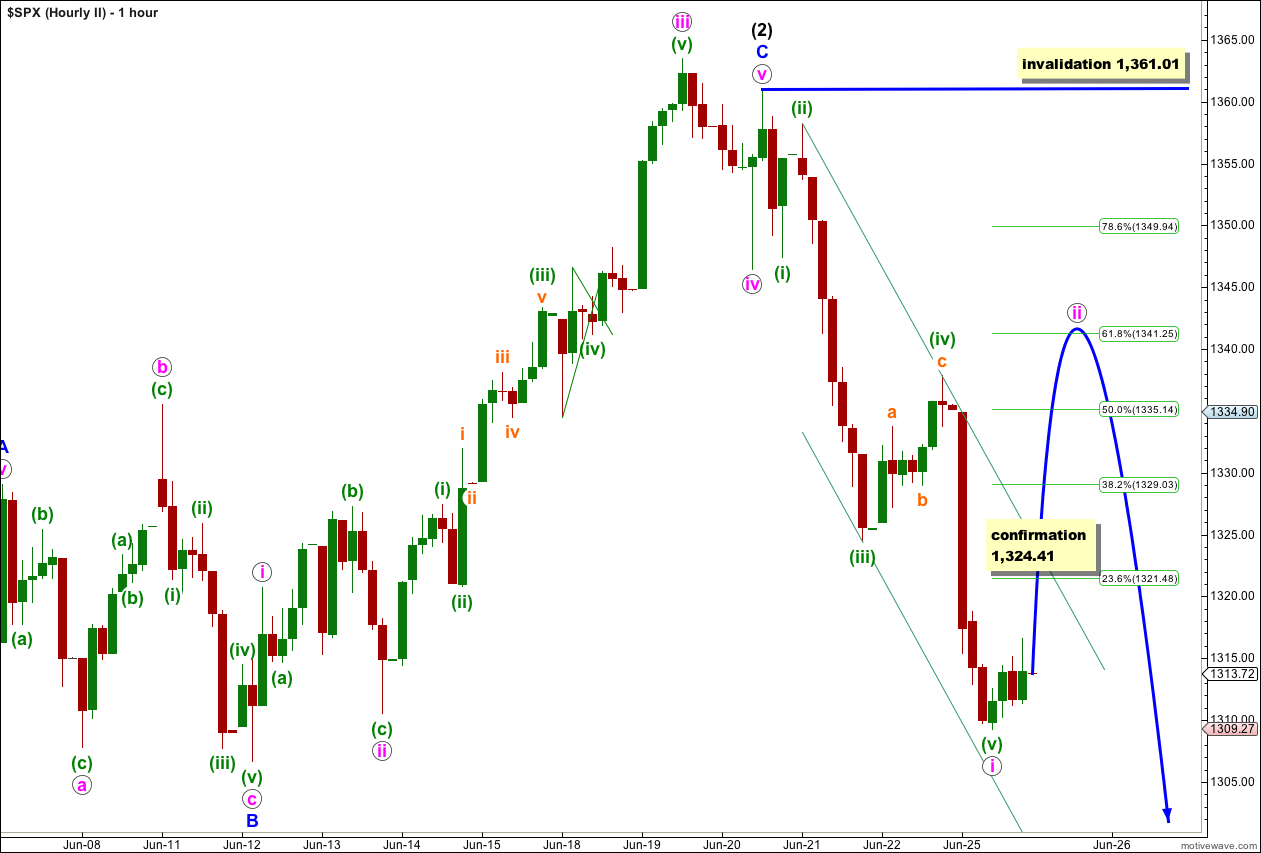
This wave count has a lower probability than the first hourly chart because this wave count does not agree with MACD. However, although MACD is an excellent guide particularly to where the third wave is located within an impulse, it is not foolproof and sometimes does not always work. For this reason we may consider this wave count but only if it is confirmed with movement above 1,324.41.
Movement above 1,324.41 would invalidate the first hourly chart and would provide confirmation that the first five down is over and upwards movement would most likely be a second wave correction. At that stage the parallel channel about wave i pink downwards should also be breached by upwards movement providing further confirmation that we have seen a low degree trend change.
Wave ii pink would most likely reach up to about the 0.618 Fibonacci ratio of wave i pink at 1,341.25.
Wave ii pink may not move beyond the start of wave i pink. This wave count is invalidated with movement above 1,361.01.
Alternate Wave Count.
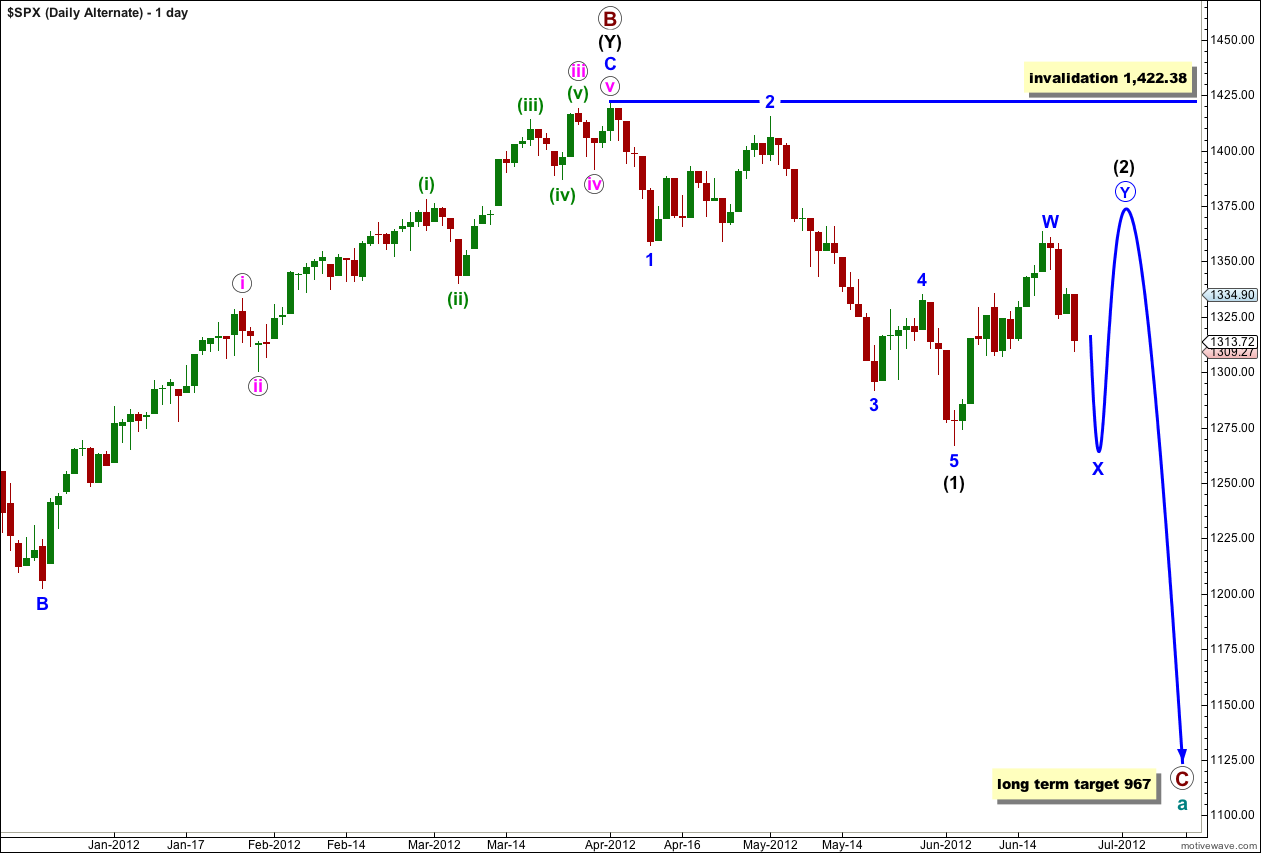
This alternate wave count is identical to the main wave count with the sole exception of looking at wave (2) black as a double rather than a single.
If this wave count is correct then the next movement would be downwards in a three wave structure for an X wave. This is most likely to be a zigzag.
Wave X blue may make a new low below the start of wave W blue, but it is unlikely to. There can be no downwards invalidation point for this reason. We will have to pay close attention to structure to indicate which of our two wave counts is correct.
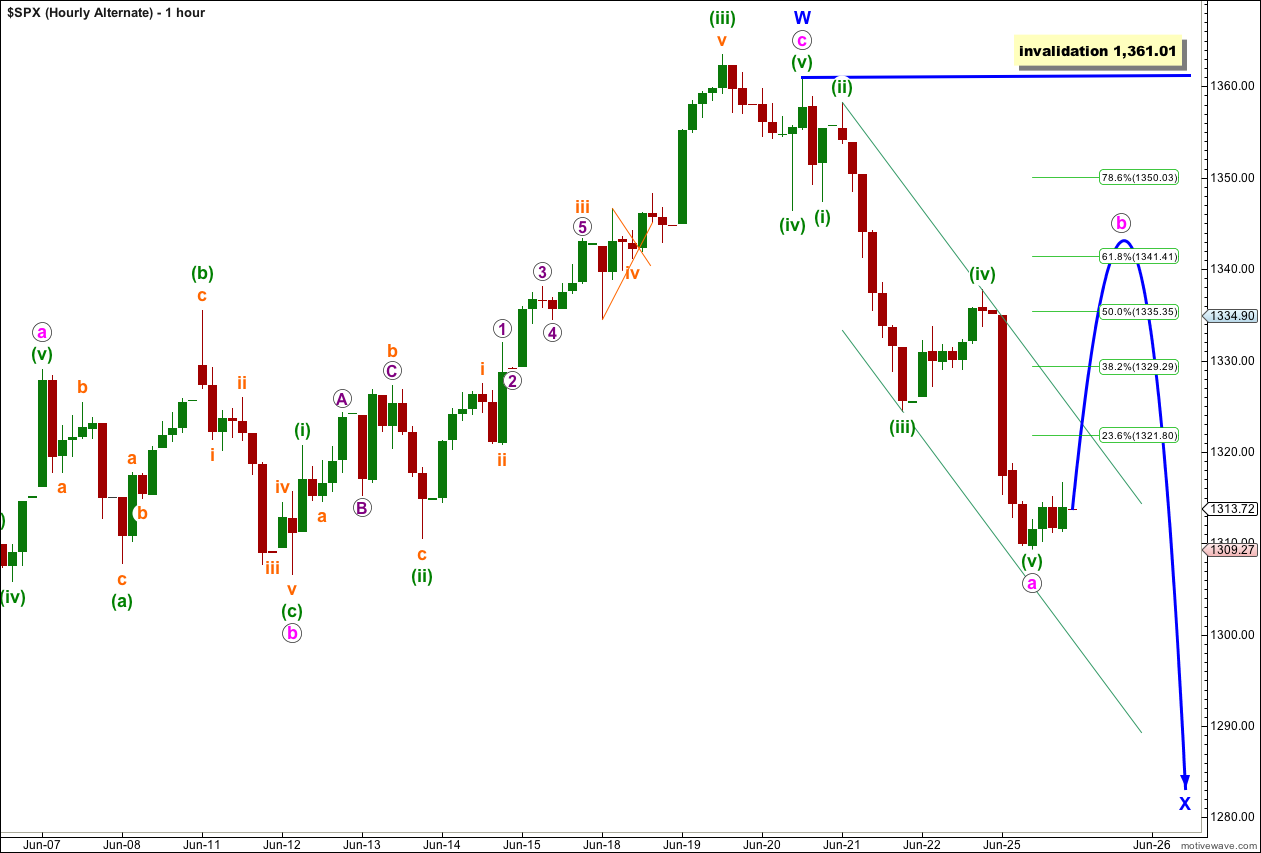
If wave X blue is underway then it is most likely to subdivide into a 5-3-5 zigzag. Wave a pink would be over and wave b pink would now be underway.
Wave b pink would most likely reach up to about the 0.618 Fibonacci ratio of wave a pink at 1,341.41.
Within wave a pink this wave count does not agree with MACD, which further reduces the probability that this wave count is correct.
Wave b pink may not move beyond the start of wave a pink. This wave count is invalidated with movement above 1,361.01.
Hi Lara,
On my chart (admittedly Good All Markets – so not just NY opening) I have divergence between the bottoms of the 21st and the 25th with both MACD and RSI (14). [Hourly basis].
Do you have access to such data, if so do you agree and either way what are the MACD parameters you use?
“Do you have access to such data”
Nope.
And that’s not the data I’m using.
the NY session data shows no divergence, so that’s what I’m going on.
When I use MACD I leave it on default parameters. If I can be bothered sometimes I change it to 8, 13 and 34 only because they’re Fibonacci numbers. But I’ve noticed it makes little difference.
Thank you for your analysis so far.
Hi Lara,
I have another reason to substantiate your first count.
Most of the time, the bulls will think that after 2 massive selldown, the market would be due for a rebound. The market would then push have one more leg down to wipe out the bullishness of these people.
The SMA 200 would then act as the psychology support for the next rebound.
Thanks for your analysis so far.
you’re absolutely right, that’s the psychology of second waves.
thanks for pointing that out
not until we’re in the middle of a third wave will the bulls realise there’s been a trend change.