
Thursday’s analysis expected Friday’s session to begin with a little upwards movement for a low degree correction, which is exactly what happened. Price has remained below the invalidation point on the hourly chart.
The wave counts remain the same and both my main and alternate counts expect the same direction of movement next. The two wave counts differ only in the structure expected so I will be paying close attention to this.
Click on the charts below to enlarge.
Main Wave Count.
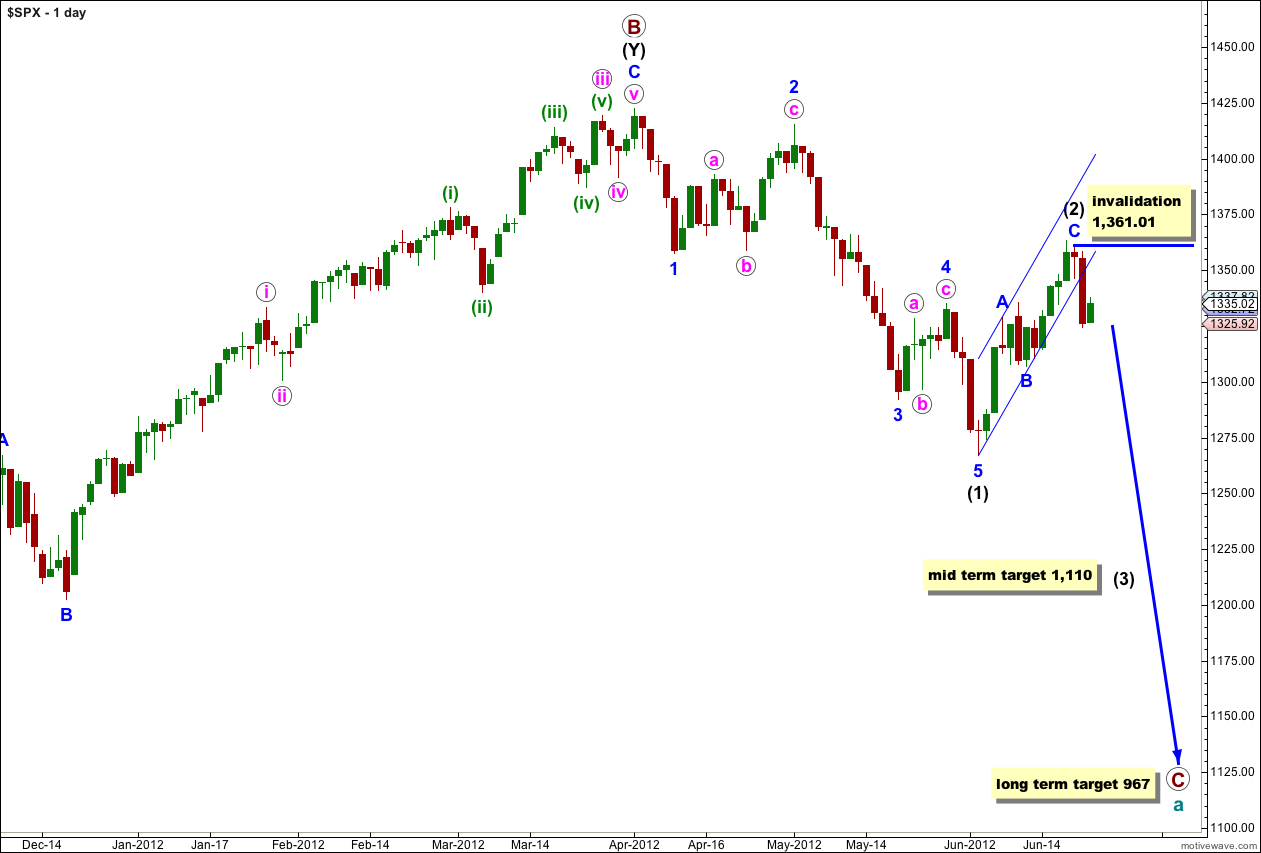
This wave count sees a big trend change at the price high of 1,422.38. Primary wave C should make substantial new lows below the end of primary wave A which had its low at 1,074.77. Primary wave C would reach 1.618 the length of primary wave A at 967, completing a typical expanded flat for cycle wave a.
At this stage the zigzag labeled wave (2) black is probably complete. The parallel channel around it is clearly breached by downwards movement. At 1,110 wave (3) black would reach 1.618 the length of wave (1) black.
At this stage the only variable is whether or not wave (2) black will be a single zigzag structure or may continue further as a double. The alternate looks at this possibility.
Within wave (3) black no second wave correction may move beyond the start of its first wave. This wave count is invalidated with movement above 1,361.01.
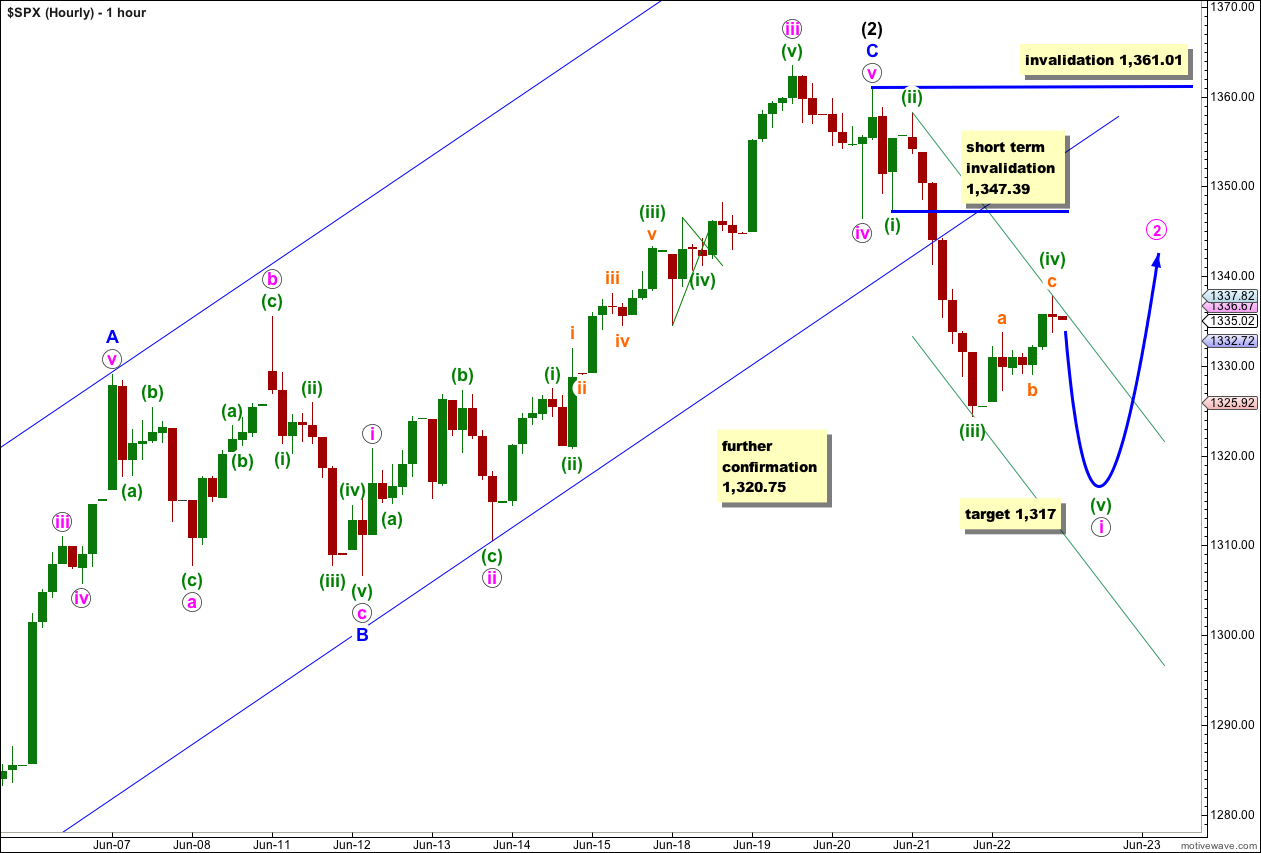
At this stage it looks most likely that wave (iv) green is over. It is a clear zigzag structure with a complex wave for b orange within it. So far wave c orange is a complete five wave impulse. There is not enough downwards movement at the end of Friday’s session to say definitively that wave c orange is complete; the final fifth wave within it could extend higher.
If Monday does see upwards movement to begin the session then wave (iv) green may not move into wave (i) green price territory. This wave count is invalidated in the very short term with movement above 1,347.39.
If wave (v) green has begun at 1,337.82 (if wave (iv) green does not move higher) then it would reach equality in length with wave (i) green at 1,317. However, wave (iii) green is just 1.8 points short of 2.618 the length of wave (i) green. With a close Fibonacci ratio already within this downwards movement it is less likely that wave (v) green will exhibit a Fibonacci ratio to either of (i) or (iii) green. This means the target of 1,317 is the most likely target, but it does not have a very high probability.
I have used Elliott’s second channeling technique to draw a channel about downwards movement. Expect wave (v) green to end mid way in this channel, or possibly about the lower edge. Because the target will be difficult to calculate this channel may be more useful.
When wave (v) green downwards completes wave i pink then we should expect a longer lasting and deeper correction for wave ii pink. Depending upon what structure wave ii pink takes it could be over quickly as a zigzag, or it could take a few days as a flat or combination. When wave i pink is complete we shall draw a Fibonacci retracement along its length and expect wave ii pink to most likely reach up to the 0.618 Fibonacci ratio.
Wave ii pink may not move beyond the start of wave i pink. This wave count is invalidated with movement above 1,361.01.
Alternate Wave Count.
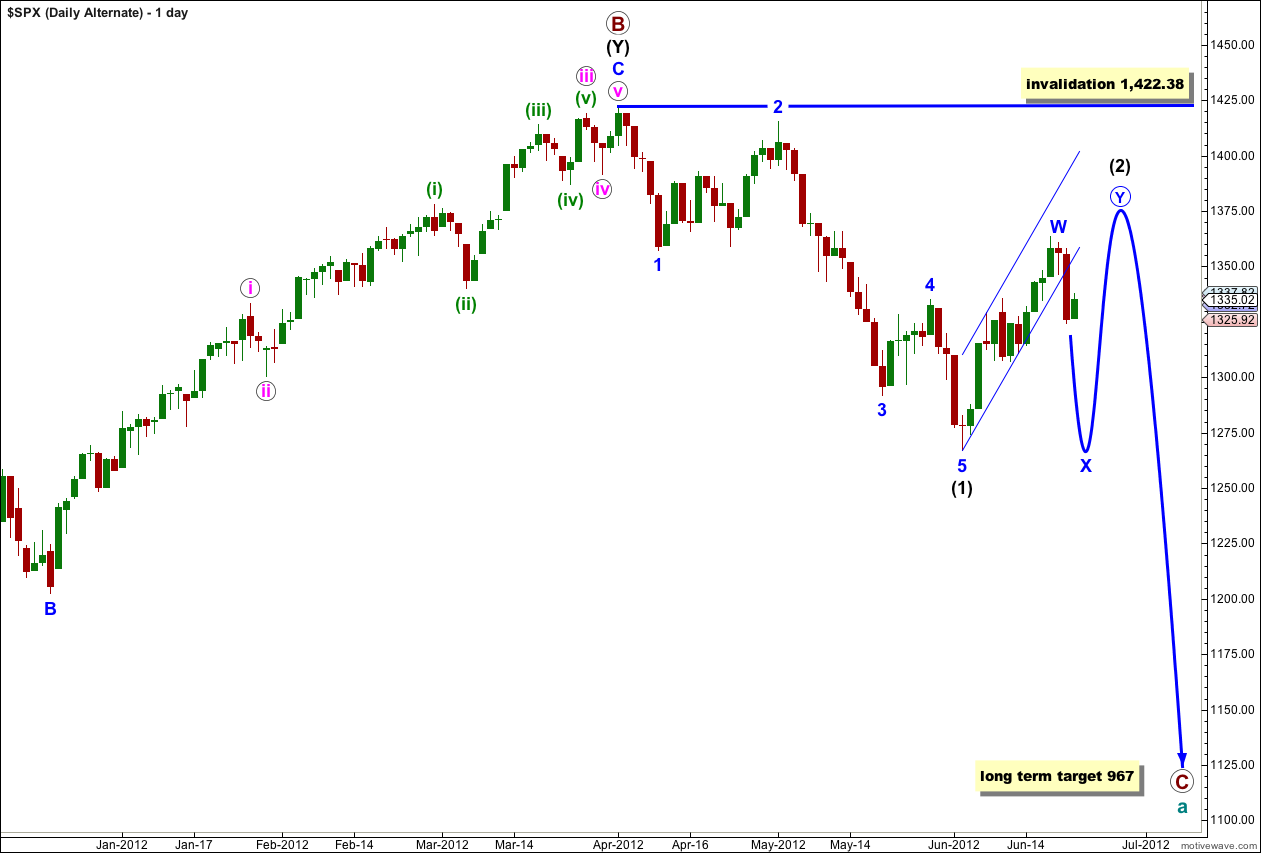
This alternate wave count is identical to the main wave count with the sole exception of looking at wave (2) black as a double rather than a single.
If this wave count is correct then the next movement would be downwards in a three wave structure for an X wave. This is most likely to be a zigzag.
Wave X blue may make a new low below the start of wave W blue, but it is unlikely to. There can be no downwards invalidation point for this reason. We will have to pay close attention to structure to indicate which of our two wave counts is correct.
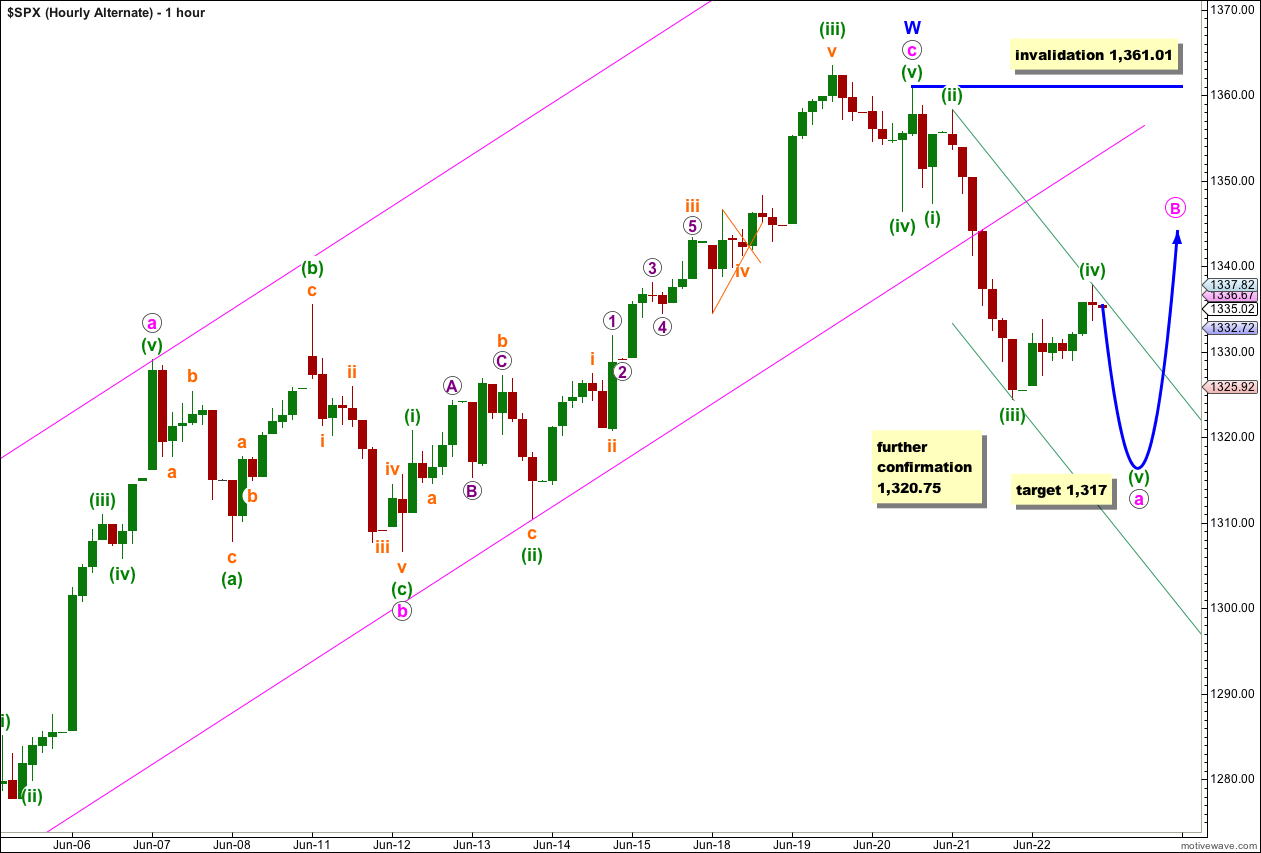
If wave (2) black is unfolding as a double then downwards movement should unfold as a zigzag for wave X blue. It is possible (but less likely) that wave X blue is over already and the next chart looks at this possibility. The chart above sees wave X blue unfolding as a more time consuming zigzag with wave a pink within it almost complete.
Wave a pink requires a final fifth wave down to complete a five wave structure. The target is the same as the main wave count for the same reasons. Thereafter wave b pink may not move beyond the start of wave a pink. This wave count is invalidated with movement above 1,361.01.
If price continues higher to begin next week and moves above 1,361.01 then we should use the wave count below.
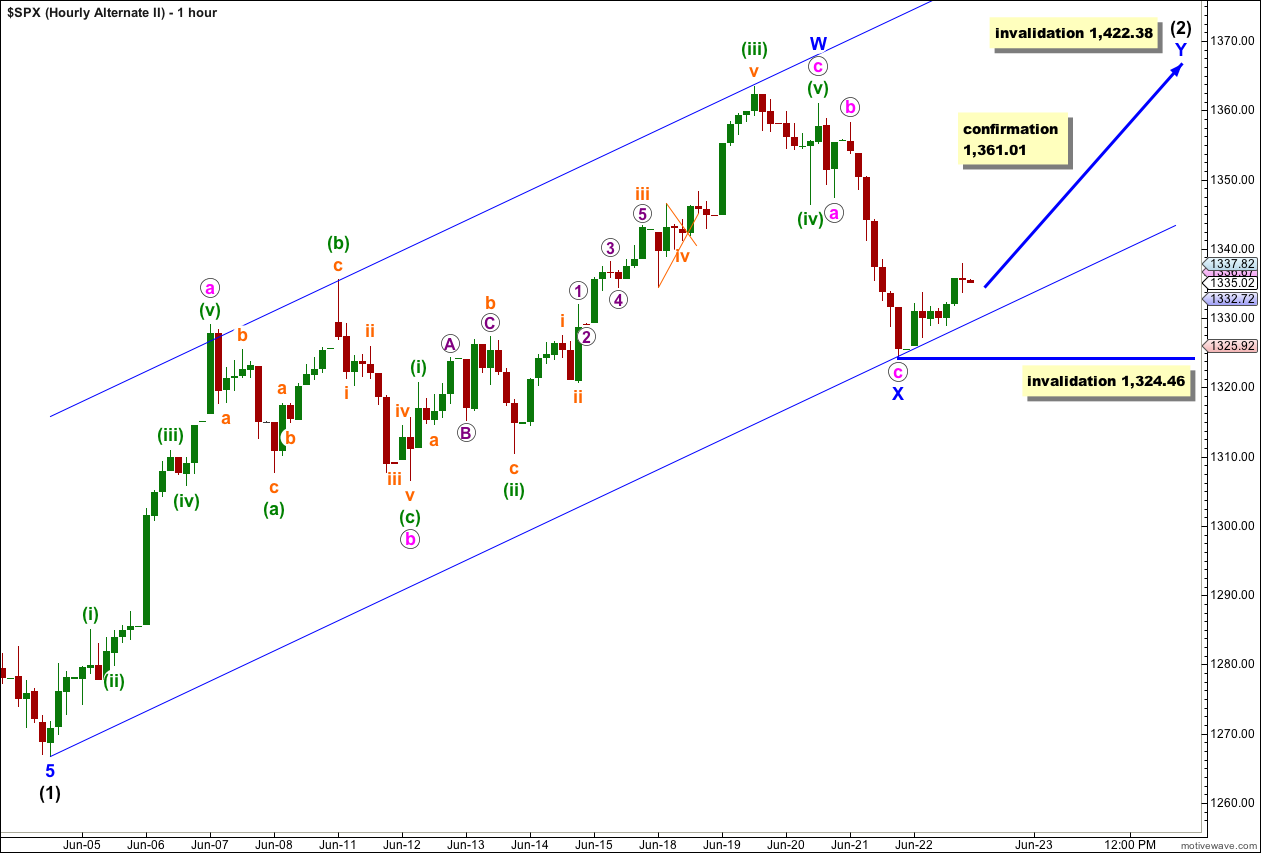
If we move the degree of labeling within wave X blue up one degree we can see that so far a three wave structure can be seen on the hourly chart. It is possible that wave X blue is complete.
When I draw a parallel channel from the start of (2) black to the low of X blue and place a parallel copy upon the price high within W blue (wave (iii) green) it matches nicely with a couple of other points within (2) black.
Wave Y blue may be (in order of probability) a zigzag, a flat or a triangle.
This wave count has a low probability and should only be considered if it is confirmed with movement above 1,361.01.
Thanks Laura… very helpful explanation!
correction: ” Wave (3) black is an impulse wave”… not impule wave? 🙂
Hey Laura,
I am trying to get synchronized with some of your color coding for your waves. Here is what I have so far.
1. Wave (1) Black was 43 days from April 2nd-June 4th.
2. Wave (2) Black was a corretive retrace from June 4th – June 19th and was 11 days
3. We are now in Wave (3) Black. I am estimating that Wave 3 Black may be at least 1.618 the length of Wave (1) black and may last 60-70 days if that happens to reach the target SPX of 1110. Wave (3) black is an impule wave and will have component waves Blue 1-5 within (3) black.
I am trying to fit the pink waves into the Blue waves. My question is… when wave i pink on the hourly chart is completed and we move on to wave 2?(or should this be ii) pink… are we also done with 1 blue? or is pink i-v all within wave 1 blue?
I am considering a short position begining during the end of wave 2 Blue and holding down to wave 5 blue.
thx.
we are only done with i pink within 1 blue.
1 blue will make up five waves at pink degree.
five blue waves make up one wave at black degree.
so when we are done with ii pink we shall have iii pink down.
when 2 blue arrives because this is within a larger impulse at intermediate (black) degree I would not expect 2 blue to reach back up into this price area, it may be a relatively shallow second wave correction. the force of a third wave at intermediate degree will “pull” everything down.
as always, with the caveat that this will be the case only if my wave count is correct!
Lara,
Your analysis and consideration of a variety of alternates is quite helpful. It is evident you work hard at this and are quite thorough. Thank you
Rodney
Thank you very much Rodney.
I’m really pleased when members understand that in presenting multiple alternates I’m trying to prepare you for each possibility I see, and not trying to provide a wave count for all directions.
When the market is clearer we have only one wave count. This is not such a time unfortunately.