
Last analysis expected upwards movement. Price has moved lower for Wednesday’s session and remains within the trend channel.
The target remains the same. I have a lower invalidation point which will prove a useful indicator for a trend change.
Click on the charts below to enlarge.
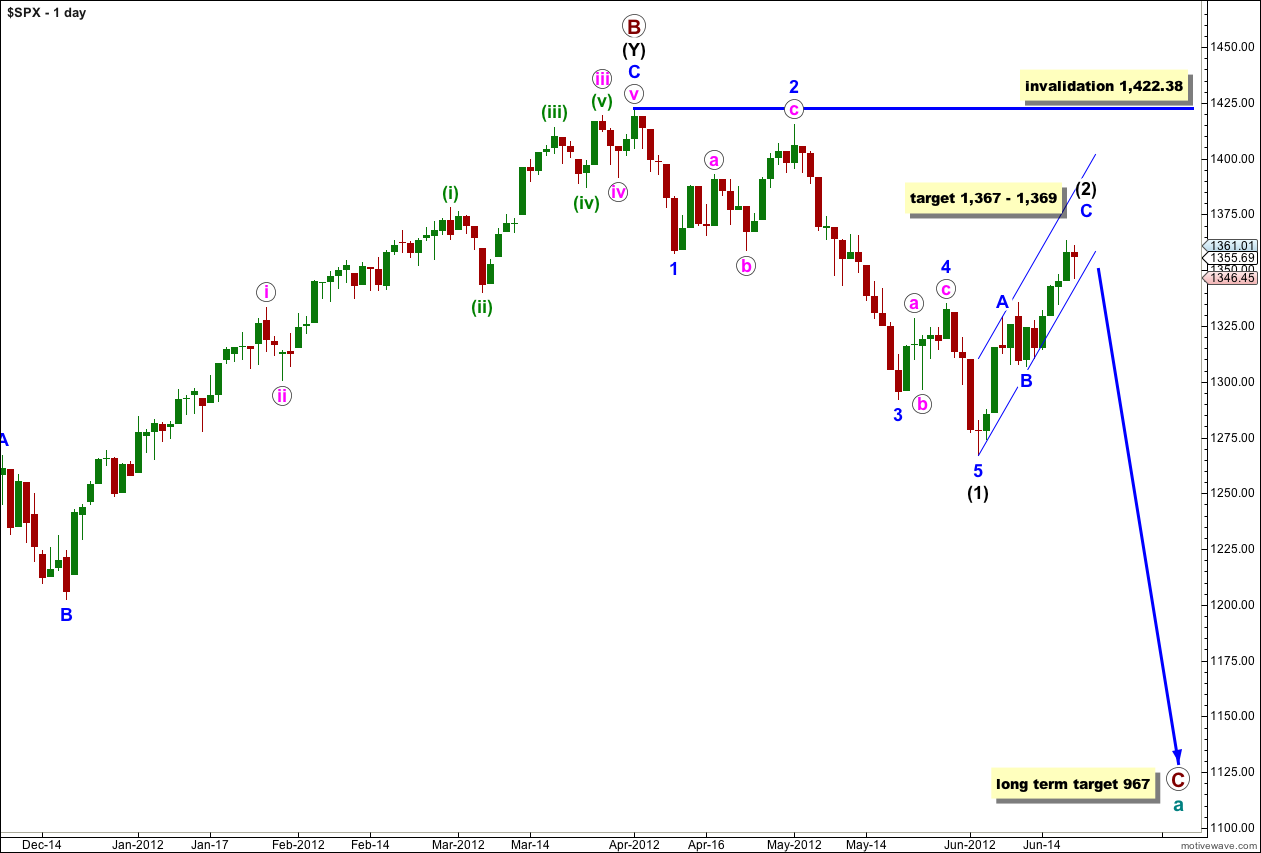
This wave count sees a big trend change at the price high of 1,422.38. Primary wave C should make substantial new lows below the end of primary wave A which had its low at 1,074.77. Primary wave C would reach 1.618 the length of primary wave A at 967, completing a typical expanded flat for cycle wave a.
At this stage the zigzag labeled wave (2) black is probably close to completion. I want to see the parallel channel around it breached by downwards movement before I am confident upwards movement is over. At that stage I would calculate targets for wave (3) black downwards. To do so prior to trend channel confirmation would be premature.
The other variable is whether or not wave (2) black will be a single zigzag structure or may continue further as a double. The alternate looks at this possibility.
Wave (2) black may not move beyond the start of wave (1) black. This wave count is invalidated with movement above 1,422.38.
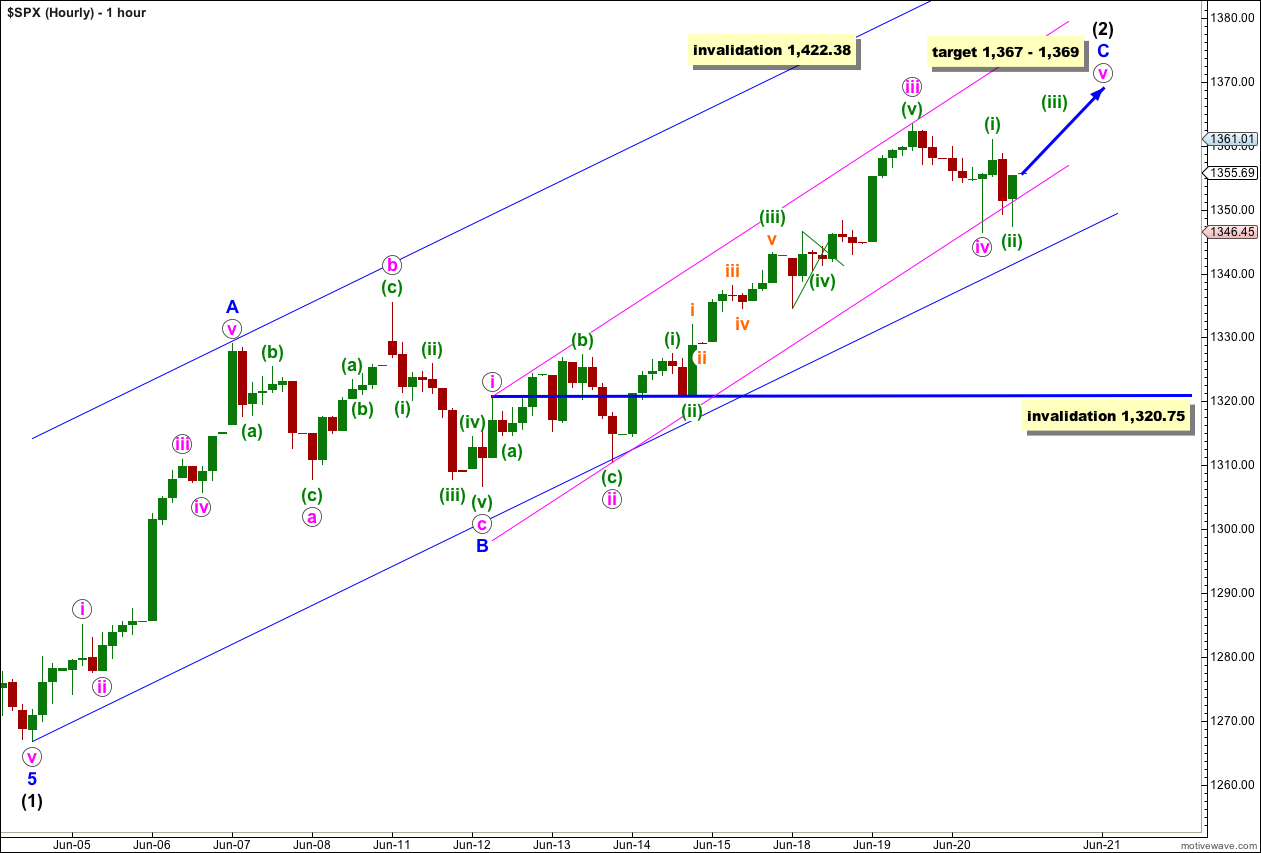
I have moved the high for wave iii pink upwards. Downwards movement for wave iv pink subdivides into a zigzag on the 5 minute chart, giving nice alternation between waves ii and iv pink with wave ii pink a flat correction.
There is no Fibonacci ratio between waves iii and i pink. This makes it more than likely we should see a Fibonacci ratio between wave v pink and either of i or iii pink. At 1,367 wave v pink would reach 0.382 the length of wave i pink. At 1,369 wave C blue would reach equality with wave A blue. This leaves us with the same 2 point target zone as yesterday.
Ratios within wave iii pink are: wave (iii) green has no Fibonacci ratio to wave (i) green, and wave (v) green is just 0.01 shorter than equality with wave (iii) green.
Ratios within wave (iii) green are: wave iii orange has no Fibonacci ratio to wave i orange, and wave v orange is just 0.37 points shorter than equality with wave iii orange.
Wave (iv) green may be seen as a running triangle on the 5 minute chart which has a much better fit, and makes wave (v) green also have a much better fit.
On the 5 minute chart upwards movement labeled wave (i) green within wave v pink subdivides nicely into a five wave impulse, and downwards movement labeled wave (ii) green fits most easily as a zigzag. It looks like overall still upwards movement is impulsive and downwards movement is corrective, indicating that the trend remains upwards.
I would expect wave v pink to take at least one more session to complete. If it is over in just one more session then the entire correction for wave (2) black would have lasted a Fibonacci 13 days. If it is not over after tomorrow then the next Fibonacci number in the sequence is 21 meaning another 8 sessions of corrective movement.
It is possible at this stage that wave iv pink is not over and could continue further as a double zigzag or a flat correction. If it does continue lower then it may not move into wave i pink price territory. This wave count is invalidated in the short term with movement below 1,320.75. Eventually price movement below this point would strongly indicate a trend change, and this price point will be useful to us in the near future.
Alternate Wave Count.
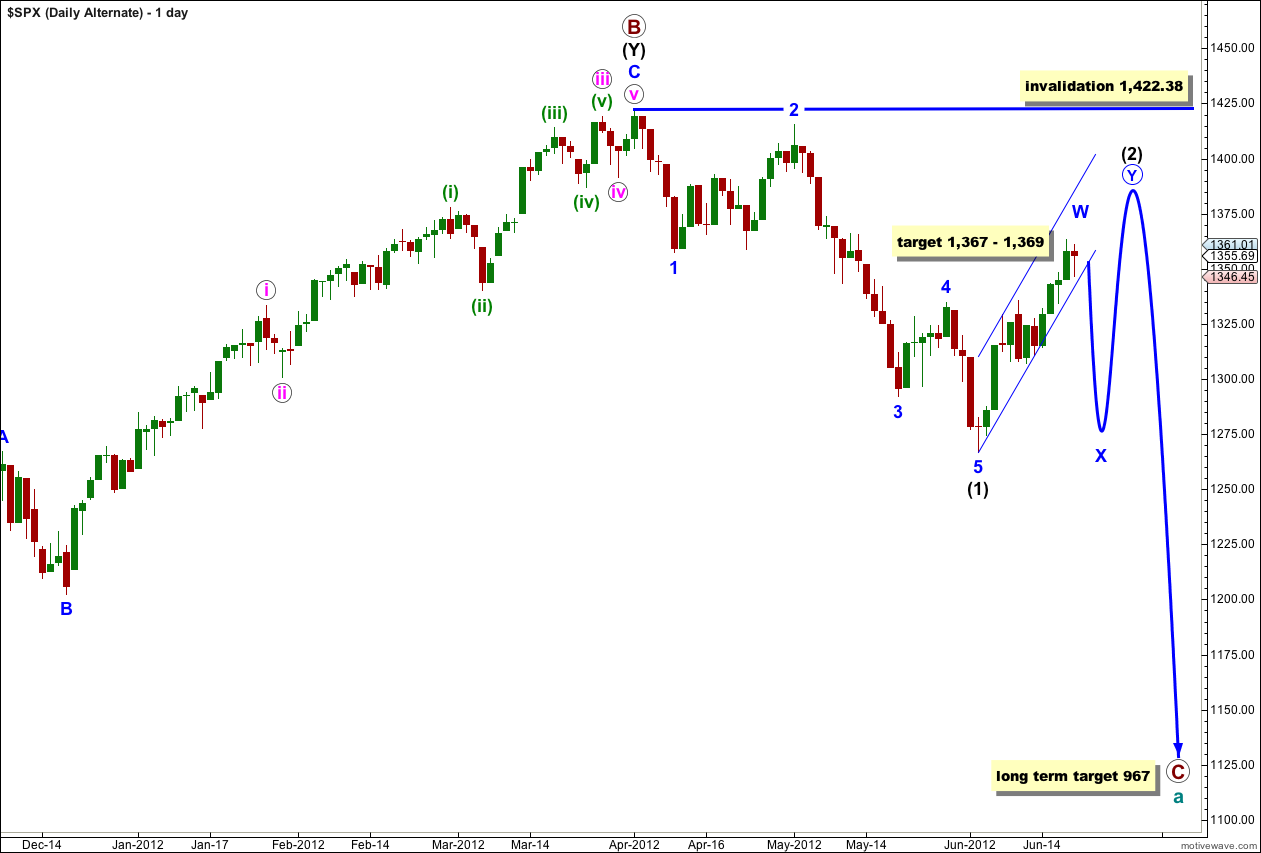
This alternate wave count is identical to the main wave count with the sole exception of looking at wave (2) black as a double rather than a single.
If this wave count is correct then when the first zigzag is over the next movement would be downwards in a three wave structure for an X wave. This is most likely to be a zigzag.
Wave X blue may make a new low below the start of wave W blue, but it is unlikely to. There can be no downwards invalidation point for this reason. We will have to pay close attention to structure to indicate which of our two wave counts is correct.
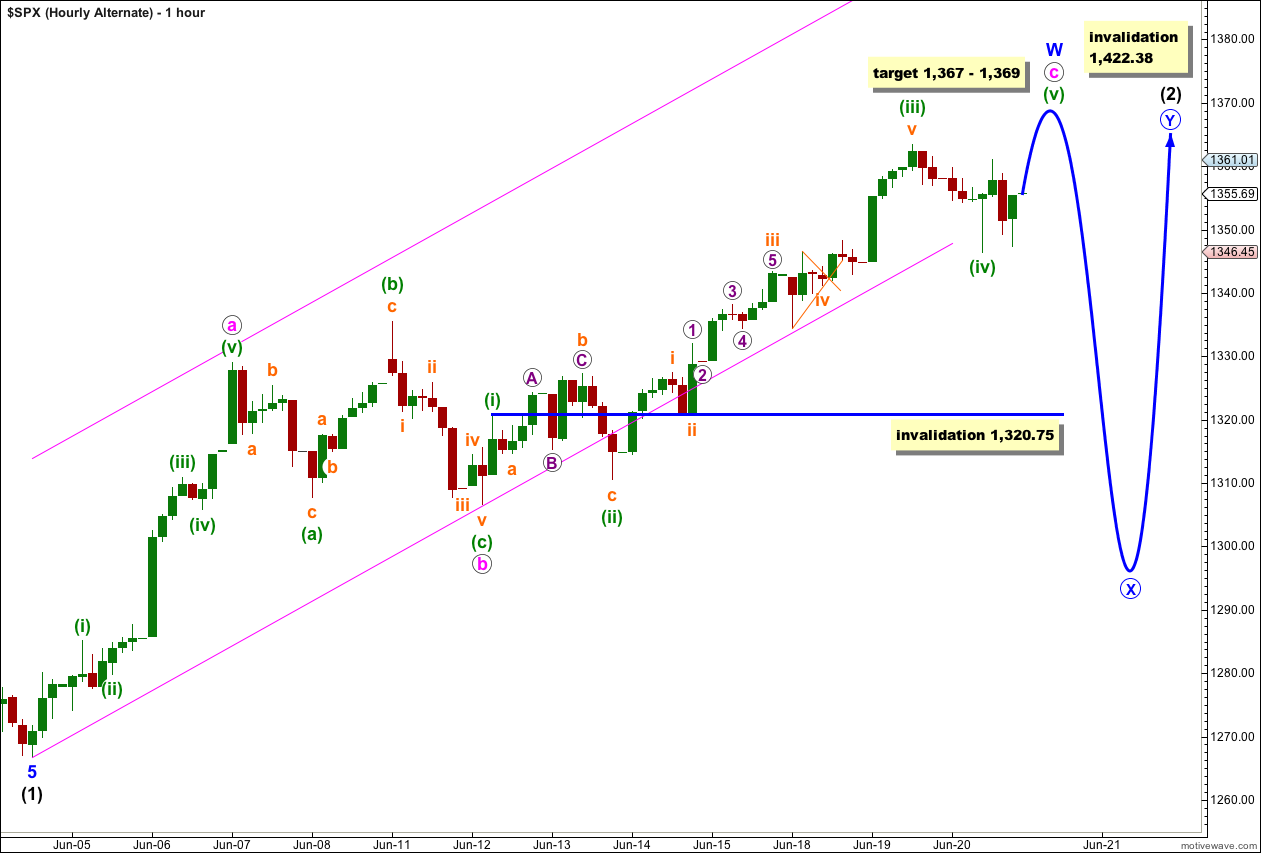
This hourly chart is identical to the main hourly chart except everything within wave (2) black is moved down one degree as it looks at wave (2) black as a possible double.
Targets and invalidation points are the same for the same reasons.
Sorry – 1327.28 is currently labelled wave b orange and not wave b green as I had said in the last message.
Hello Lara,
In the main wave count, there is a lot of reliance upon the invalidation point of wave 1 pink of wave C blue at 1320.75. Given last nights low was 1324.41 the main count technically remains valid. However, wave 1 pink of wave C blue could be counted at the top of the pivot at 1327.28 which you have labelled wave b green. This wave count would invalidate any further upwards movement in wave C blue.
Could you please advise your level of probability towards labelling wave 1 pink of wave C blue at 1320.75 as well as the alternative labelling at 1327.28.
Thanks!
Sweet ride down … ES 1317.50 low
Your key line still holding
Playing the double bust .. Symmetrical Triangle long 1335 ES
Lets see if we can make into July 4th now
Goldman Goes Short The S&P 500: 1285 Target —
Truncation 5th Wave