
Yesterday I had three hourly wave counts which all expected downwards movement which is not what happened. However, movement above 1,335.52 has confirmed that this correction is not over and upwards movement to end the week has a clear structure.
I have only one hourly wave count today which suffices for both daily charts.
Click on the charts below to enlarge.
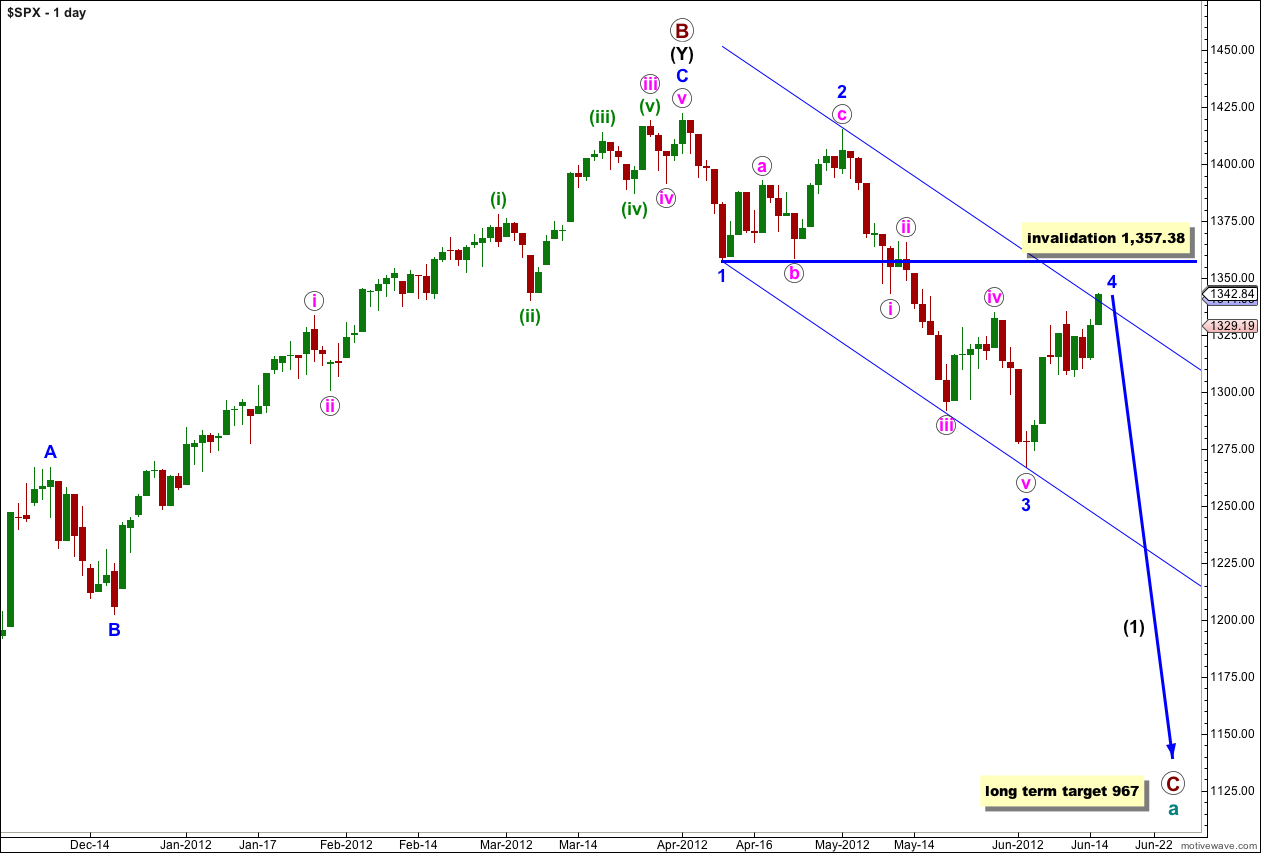
We have recently seen a very large trend change on the S&P 500 and a new downwards trend, to last months, has begun.
At cycle degree wave a (teal green) is an expanded flat correction. Primary wave A (maroon) within it subdivides into a three, and primary wave B is over 105% of primary wave A at 123%. The minimum requirements for an expanded flat are met. We should expect primary wave C to subdivide into a five and move price substantially below the end of primary wave A at 1,074.77.
At 967 primary wave C would reach 1.618 the length of primary wave A. If price continues through this first target, or it gets there and the structure is incomplete, then our second (less likely) target is at 685 where primary wave C would reach 2.618 the length of primary wave A.
Primary wave A lasted 4 months. Primary wave B lasted 6 months. We may expect primary wave C to last at least 4 months, if not longer.
Wave 4 blue may not move into price territory of wave 1 blue. This wave count is invalidated with movement above 1,357.38.
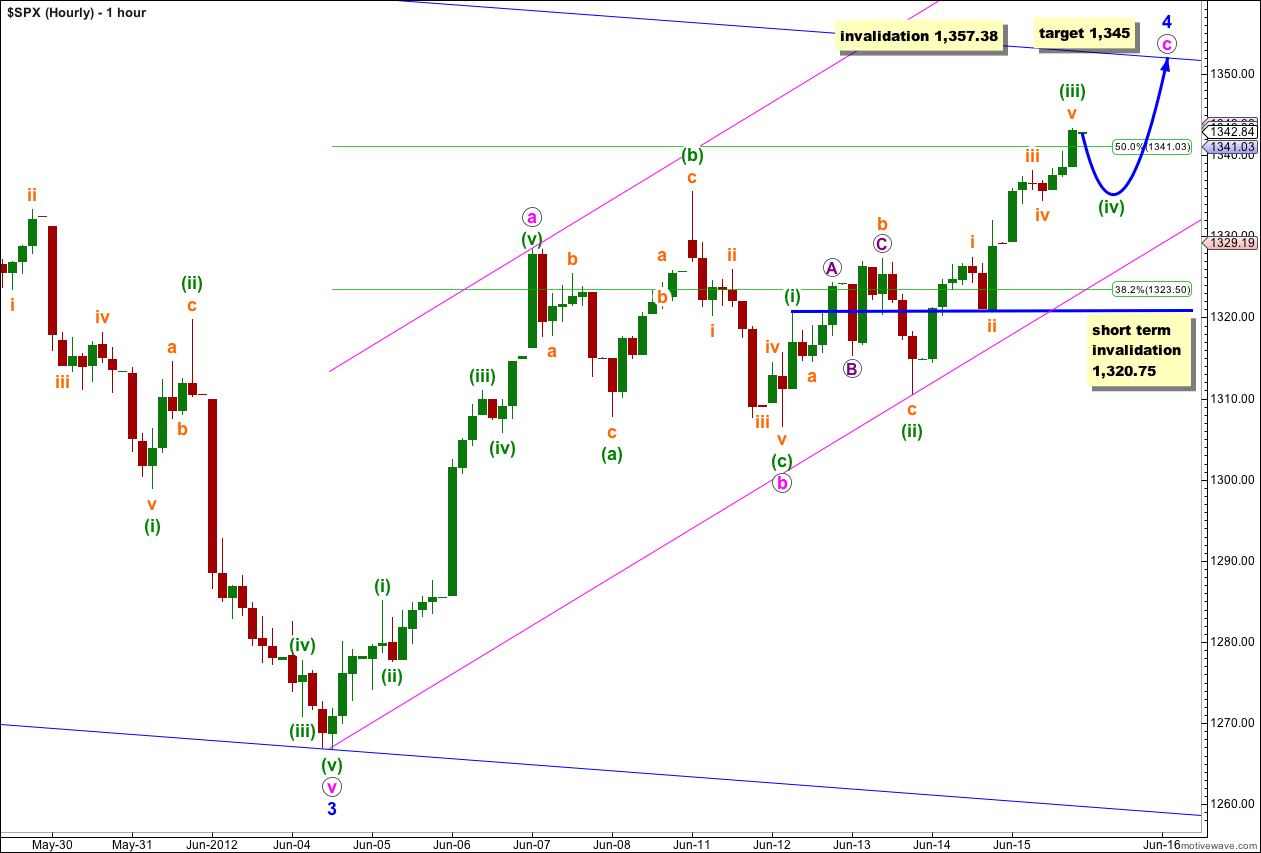
Upwards movement must be a continuation of wave 4 blue, and is probably wave c pink to end wave 4 blue. It is unlikely to be an ending diagonal (unless it is enormously expanding, which looks odd) and is most likely to be an impulse. Either way, the structure within the last wave of this correction is incomplete and requires at least one more upwards wave to end it.
Within wave c pink waves (i) through (iii) green are complete. Wave (iv) green must move a little lower. Wave (iv) green may not move into wave (i) green price territory. This wave count is invalidated with movement below 1,320.75 in the short term.
Wave (iii) green has no Fibonacci ratio to wave (i) green. It is more likely then that wave (v) green will exhibit a Fibonacci ratio to either of (i) or (iii) green. The most likely ratio is equality with wave (i) green, which was 13.83 points, and the next most likely ratio is 0.618 the length of wave (iii) green which is 20.27 points. When wave (iv) green completes expect a final upwards wave of either 14 or 20 points in length.
Wave (iv) green is likely to find support about the lower edge of the parallel channel drawn using Elliott’s technique about wave c pink. It is most likely to end about the fourth wave of one lesser degree; wave iv orange ends at 1,334.47.
At this stage the target for wave c pink to end is 0.618 the length of wave a pink at 1,345. This target may be too low though and a new target may be calculated, which has a higher probability of accuracy, when wave (iv) green within c pink is complete.
Alternate Daily Wave Count.
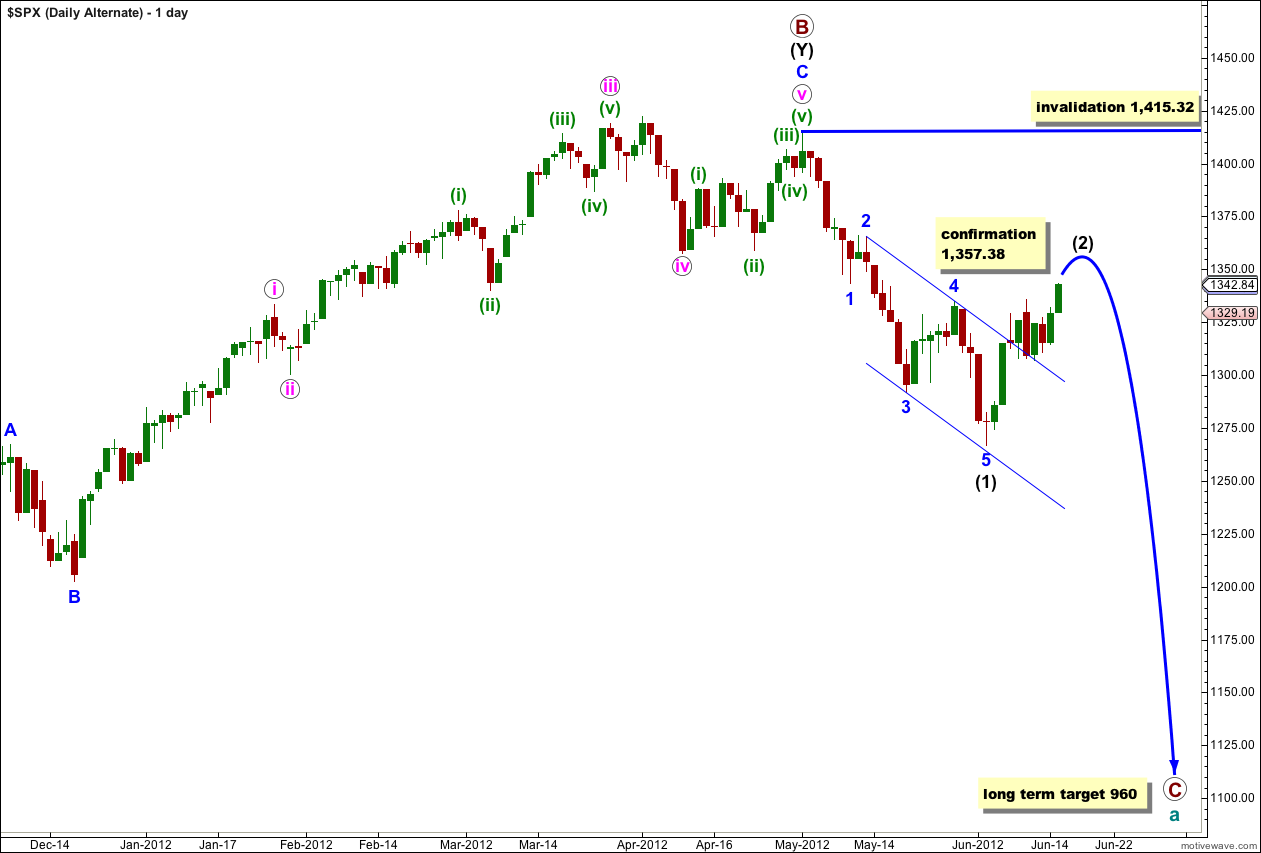
Primary wave B may have ended at 1,415.32 with a fifth wave truncation. The truncation reduces the probability of this alternate.
Wave (1) black is complete. This alternate now expects a second wave correction for wave (2) black. Wave (2) black can move right up to, but not above, 1,415.32.
This wave count diverges from our main wave count. The price point which differentiates the two is 1,357.38. The main wave count would not allow movement above that price point and this alternate sees it as reasonably likely. If price did move above 1,357.38 the main wave count would be invalidated and this alternate would be our sole wave count.
This alternate wave count expects a more long lasting and deeper correction than our main wave count. If this alternate is correct then intermediate wave (2) may last at least 4 weeks and possibly longer.
Wave (2) black may not move beyond the start of wave (1) black. This wave count is invalidated with movement above 1,415.32.
I would think we could push into the IHS target and 1403.39 would be the key.
Could there be a possibility that wave 4 blue is over? Where you have b pink circle labeled, an ending diagonal could have started as a c pink circle . Let us know if this is a possibility, thanks.
possible, if you push it to try to make it fit, yes, but it does not look like an ending diagonal.
the problem with ending diagonals is all the subwaves must be zigzags. that is hard to fit in that movement, and I cannot see how it could fit and be complete.
also, within a diagonal 4 must overlap 1 price territory.
What does this look like?
Wave 1 1296.53 5/23
with truncated wave 5
W 134.93 5/29
X 1266.74 6/4
a 1335.52 6/11
b 1306.62 6/12
Currently we are in wave (iii) from 1310.51 6/13
Wave 2 (c=a) 1374.72
No QE3 we get a big Wave 3 down
I’m sorry Karen, a chart is so much easier to see what you mean. you can upload one to twitpics or similar and post a link here.
Sorry … just do not like to post charts.
http://twitpic.com/9xmg34/full
Please take a look at this count
that looks quite feasible actually, and I can see all the subdivisions fitting quite nicely.
the only thing which looks slightly odd is the X wave making a new low; an expanded flat would fit in there much better as that is what that formation looks like. however, that does not mean a double with an X wave is invalid, as it fits well.
Sorry for the typo … a=c 1374.72 … not a=b 1374.72 which is on the chart.
If it works … you are free to use it.
Lara,
If the DOW is in Minor wave 2 up count, its unlikely the count above SPX for a Wave 4?
For alt. to be Intermediate Black (2) its too short a time and points to complete (1) black?
Please explain,thanks
that’s why I have the alternate spx count; it’s in line with the Dow.
I would expect that yes, for the alt (1) intermediate is over. when I look at it with the target in mind on the monthly chart that looks right. I expect it would see an extended (3) intermediate to follow, which is common.