
Yesterday’s main wave count expected upwards movement for Wednesday’s session. Price moved slightly higher but overall has closed lower for the session. Price remains above the invalidation point. With mostly sideways movement for a few days now the main hourly wave count is adjusted.
When this sideways movement is over the mid term expectation for this correction to continue is unchanged.
I still have two hourly wave counts today with the alternate having reduced further in probability.
Click on the charts below to enlarge.
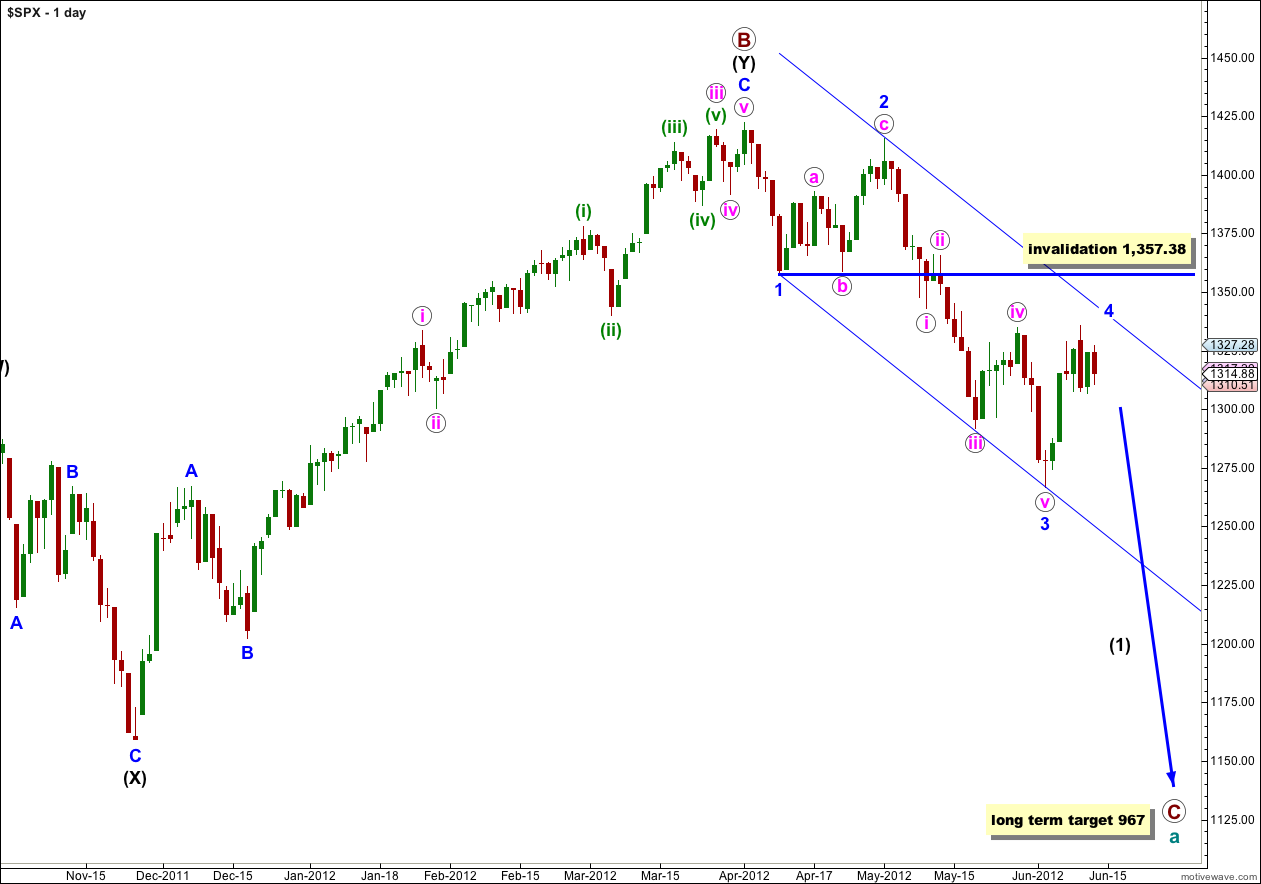
We have recently seen a very large trend change on the S&P 500 and a new downwards trend, to last months, has begun.
At cycle degree wave a (teal green) is an expanded flat correction. Primary wave A (maroon) within it subdivides into a three, and primary wave B is over 105% of primary wave A at 123%. The minimum requirements for an expanded flat are met. We should expect primary wave C to subdivide into a five and move price substantially below the end of primary wave A at 1,074.77.
At 967 primary wave C would reach 1.618 the length of primary wave A. If price continues through this first target, or it gets there and the structure is incomplete, then our second (less likely) target is at 685 where primary wave C would reach 2.618 the length of primary wave A.
Primary wave A lasted 4 months. Primary wave B lasted 6 months. We may expect primary wave C to last at least 4 months, if not longer.
Wave 4 blue may not move into price territory of wave 1 blue. This wave count is invalidated with movement above 1,357.38.
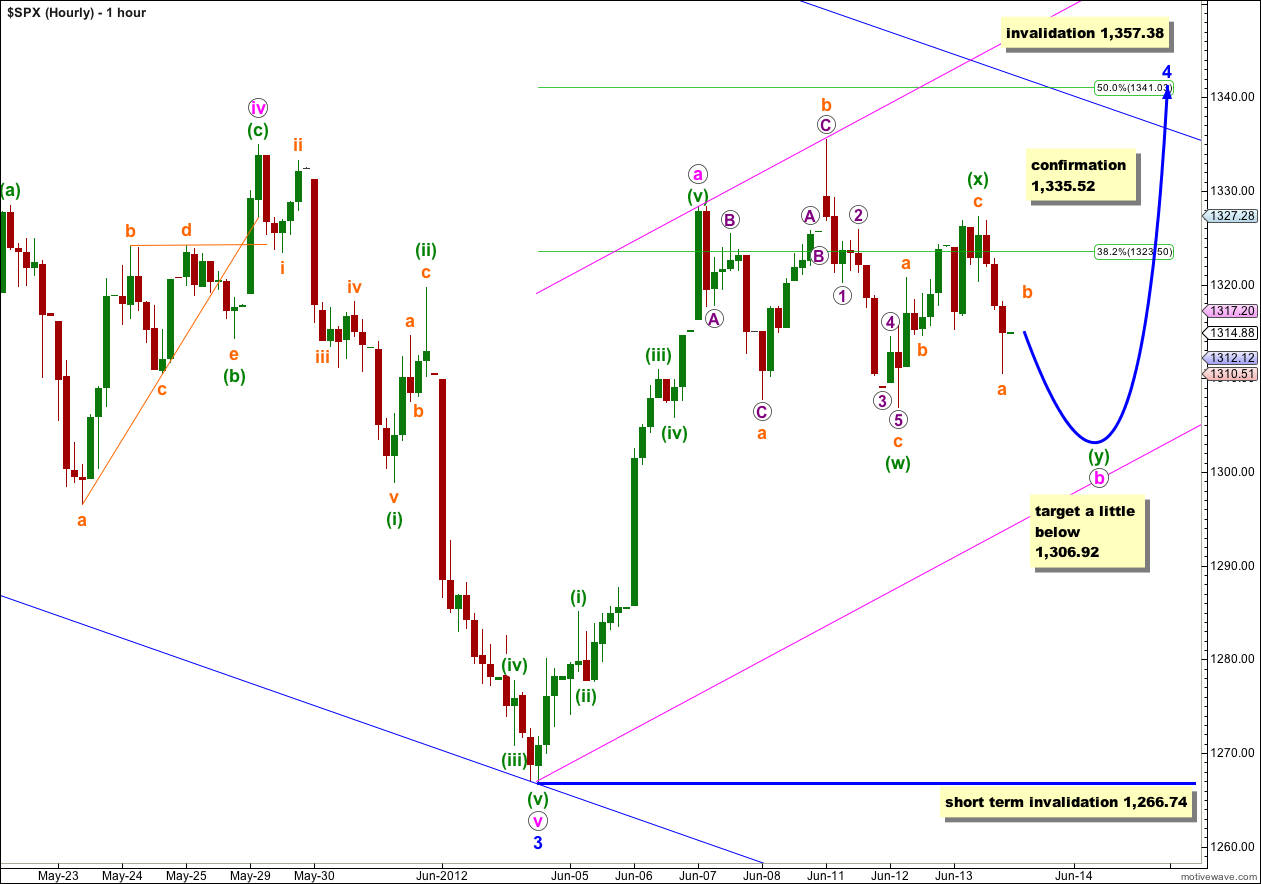
It looks like wave b pink within wave 4 blue is continuing as a more complicated double combination correction. This makes sense as then wave 4 blue would be longer in duration and more in proportion to wave 2 blue which lasted 15 sessions.
Within this double for wave b pink the first structure, labeled wave (w) green, is a flat correction. The second structure is most likely to be a zigzag because so far downwards movement to end Wednesday’s session labeled wave a orange has an impulsive look and wave count.
Wave (y) green, the second structure in the double, may unfold as a zigzag (most likely), a flat or a triangle. If it is a flat or triangle then wave b orange may make a new high above the start of a orange at 1,327.28. This is why there is no upper short term invalidation point.
I would expect a second structure to take another two sessions, possibly longer, to complete.
When it is done this wave count expects a final five up for wave c pink to complete wave 4 blue zigzag. Wave c pink may find resistance at the upper edge of the parallel channel drawn on the daily chart and copied over here.
Wave b pink may not move beyond the start of wave a pink. This wave count is invalidated with movement below 1,266.74.
Wave 4 blue may not move into wave 1 blue price territory. This wave count is invalidated with movement above 1,357.38.
Alternate Hourly Wave Count.
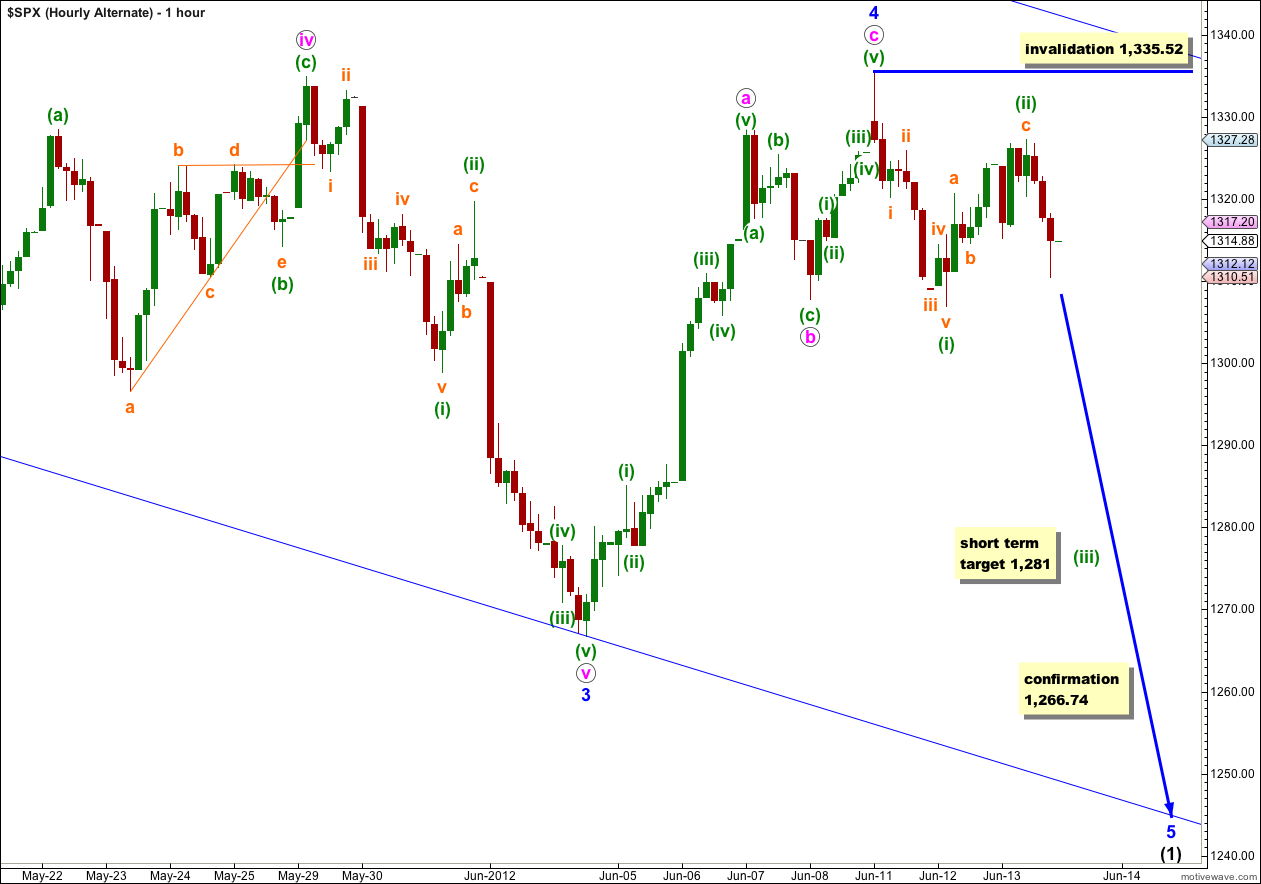
It remains possible that the correction for wave 4 blue was over in just one week. However, the probability that this wave count is correct is lower today.
For this alternate wave count wave (ii) green has moved slightly higher. At 1,281 wave (iii) green would reach 1.618 the length of wave (i) green. This target should be reached in about two sessions.
If this wave count is correct then the next movement should be downwards with increasing momentum. The only way to differentiate between this alternate and our main hourly wave count at this stage is structure; if the next downwards movement is in a clear five wave impulse then this alternate would be correct, but if the next downwards movement is in a clear three wave structure (or a sideways triangle) then the main wave count would be correct.
The only price point at this stage which would confirm this alternate is 1,266.74. Movement below that point would invalidate the main wave count and confirm this alternate.
To the upside movement above 1,335.52 would invalidate this alternate wave count because (ii) green may not move beyond the start of wave (i) green. At that stage the main wave count would be confirmed.
Alternate Daily Wave Count.
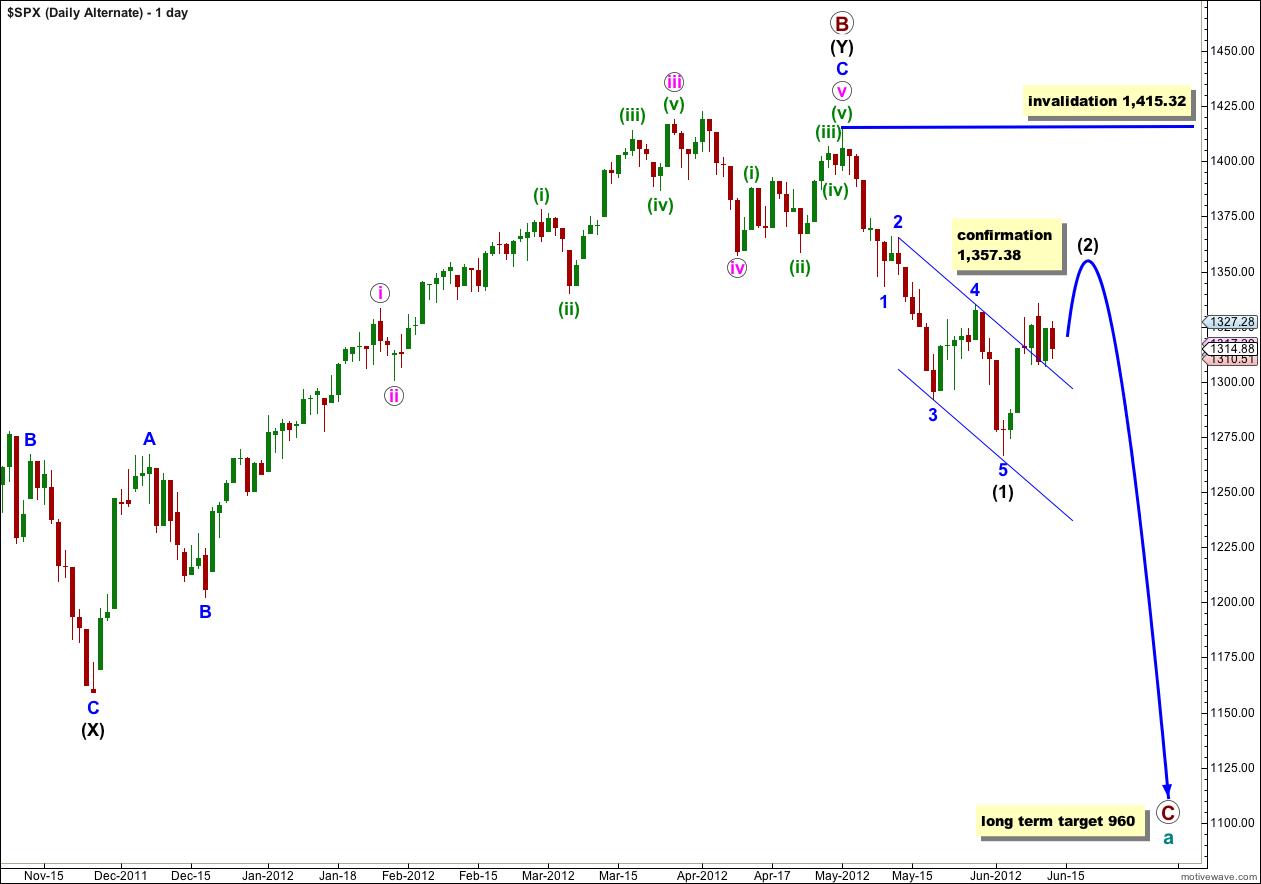
Primary wave B may have ended at 1,415.32 with a fifth wave truncation. The truncation reduces the probability of this alternate.
Wave (1) black is complete. This alternate now expects a second wave correction for wave (2) black. Wave (2) black can move right up to, but not above, 1,415.32.
This wave count diverges from our main wave count. The price point which differentiates the two is 1,357.38. The main wave count would not allow movement above that price point and this alternate sees it as reasonably likely. If price did move above 1,357.38 the main wave count would be invalidated and this alternate would be our sole wave count.
This alternate wave count expects a more long lasting and deeper correction than our main wave count. If this alternate is correct then intermediate wave (2) may last at least 4 weeks and possibly longer.
Wave (2) black may not move beyond the start of wave (1) black. This wave count is invalidated with movement above 1,415.32.
I understand over 1327.28, next you will have c orange on y blue, b pink in around 1290’s
Thank you… 1290 would be a good start 🙂
Cash over the x wave …. 1327.28
Do we still have an y wave coming??