
Yesterday’s analysis expected Tuesday’s session to open with a little downwards movement to a short term target at 1,303. Price reached down to 1,306.92, 3.92 points short of the target, early in Tuesday’s session. Thereafter, price moved higher as expected.
I have an alternate hourly wave count today along with the same daily main and alternate wave counts.
Click on the charts below to enlarge.
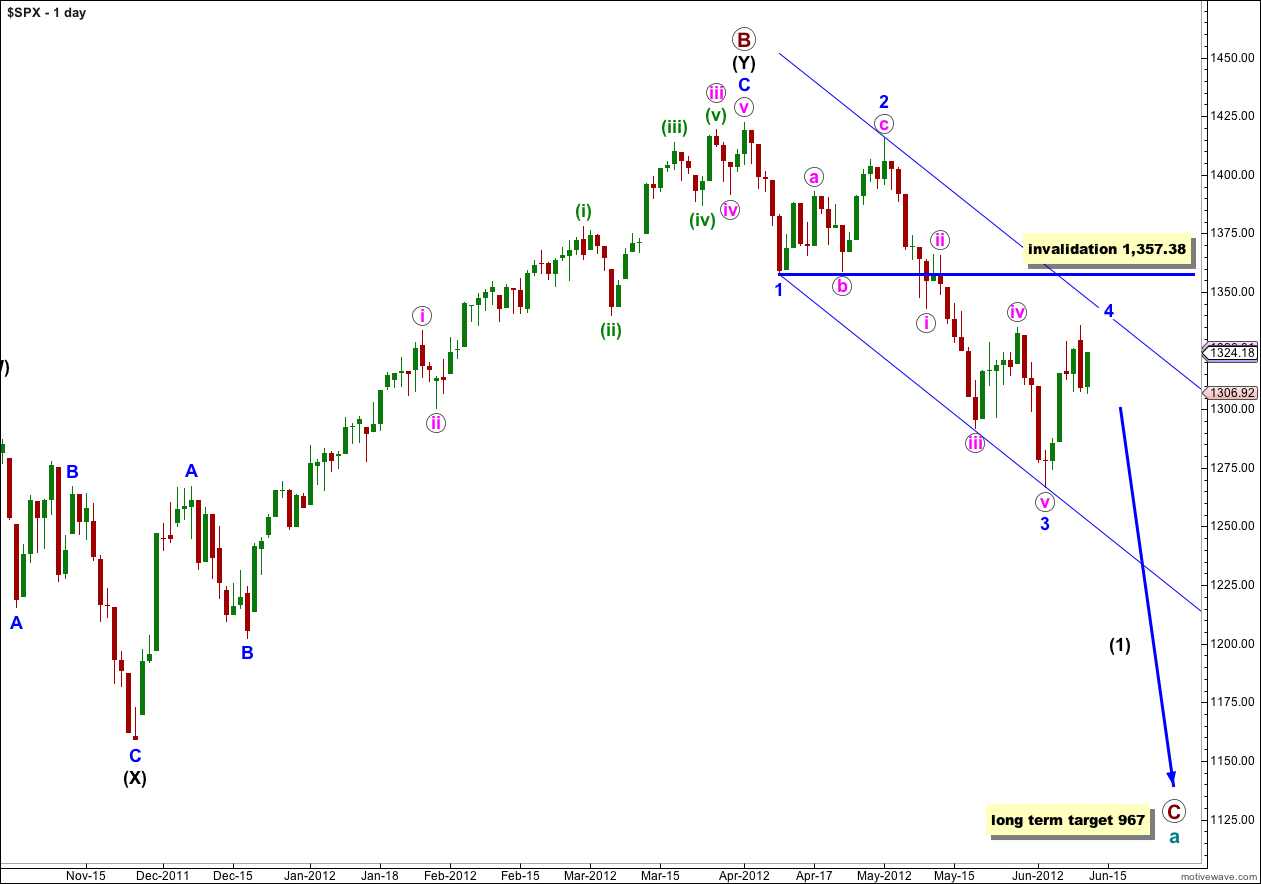
We have recently seen a very large trend change on the S&P 500 and a new downwards trend, to last months, has begun.
At cycle degree wave a (teal green) is an expanded flat correction. Primary wave A (maroon) within it subdivides into a three, and primary wave B is over 105% of primary wave A at 123%. The minimum requirements for an expanded flat are met. We should expect primary wave C to subdivide into a five and move price substantially below the end of primary wave A at 1,074.77.
At 967 primary wave C would reach 1.618 the length of primary wave A. If price continues through this first target, or it gets there and the structure is incomplete, then our second (less likely) target is at 685 where primary wave C would reach 2.618 the length of primary wave A.
Primary wave A lasted 4 months. Primary wave B lasted 6 months. We may expect primary wave C to last at least 4 months, if not longer.
Wave 4 blue may not move into price territory of wave 1 blue. This wave count is invalidated with movement above 1,357.38.
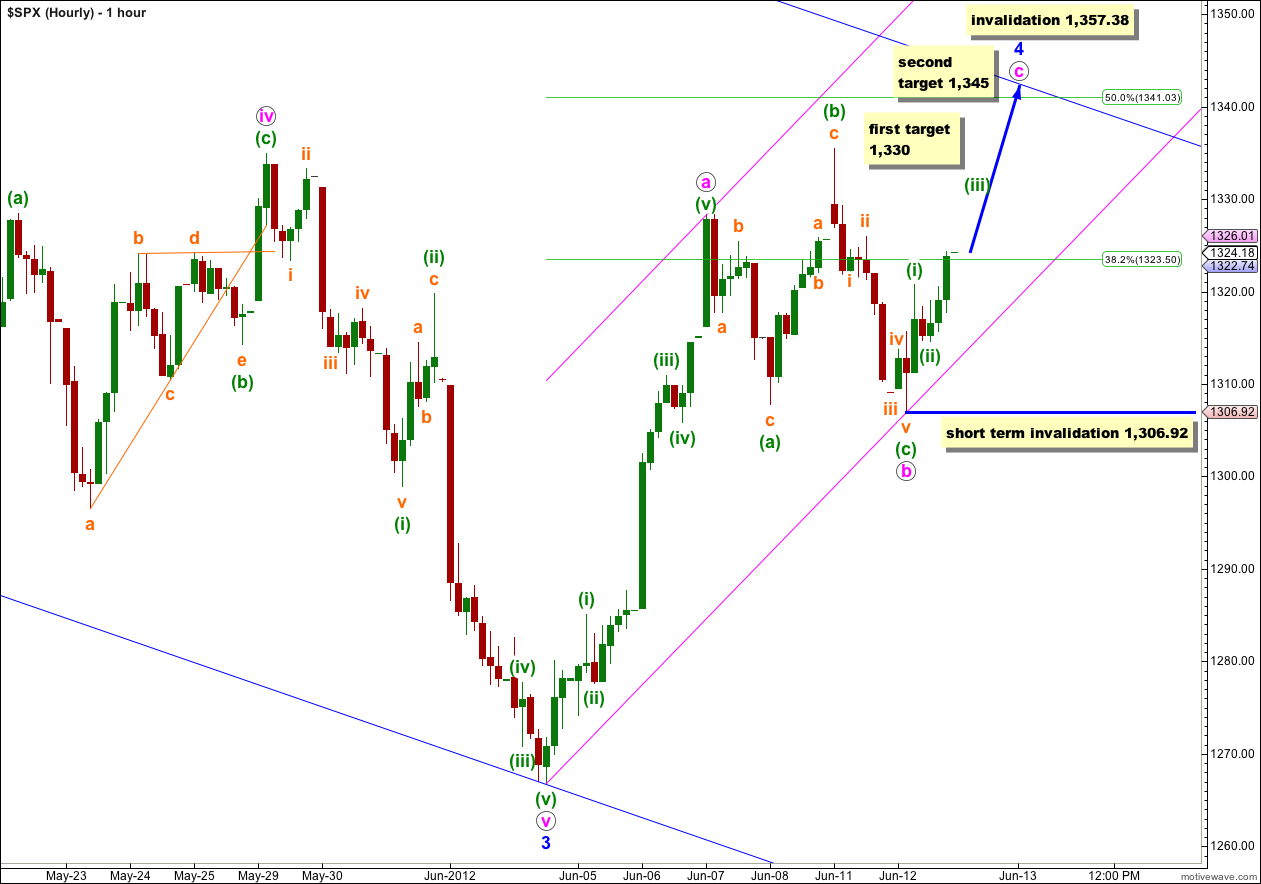
Within wave 4 blue wave b pink may have completed as an expanded flat during Tuesday’s session. Thereafter, upwards movement may be the start of wave c pink.
Wave c pink would be extremely likely to make a new high beyond the end of wave a pink at 1,327.82 to avoid a truncation.
At 1,330 wave c pink would reach 0.382 the length of wave a pink. This target looks too low, it may not leave enough room for the structure of wave c pink to unfold.
At 1,345 wave c pink would reach 0.618 the length of wave a pink. This target looks more likely and may take price to touch the upper edge of the wider blue parallel channel.
Wave 4 blue may not move into wave 1 blue price territory. This wave count is invalidated with movement above 1,357.38.
In the short term any second wave correction within wave c pink may not move beyond the start of its first wave. This wave count is invalidated with short term movement below 1,306.92. Movement below 1,314.63 (the low of (ii) green within c pink) may indicate that this wave count is incorrect, or it may indicate that my labeling within c pink is incorrect.
If price moves below 1,306.92 we may use the alternate hourly wave count below.
Alternate Hourly Wave Count.
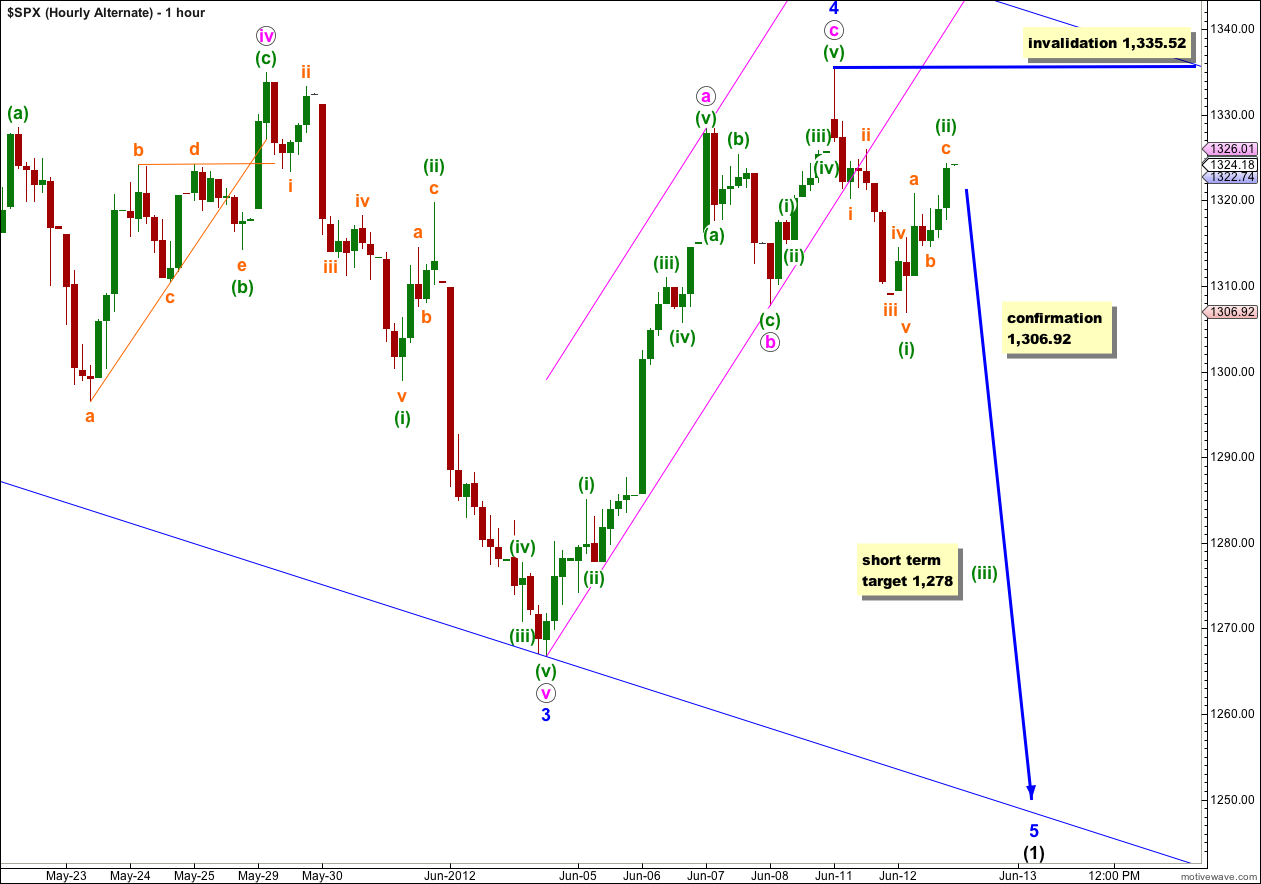
If my analysis on the 5 minute chart of the upwards wave labeled here c pink of 4 blue is incorrect on the main hourly wave count, then it may be possible that the entire correction for wave 4 blue is over.
This wave count has a lower probability than the main hourly wave count because the upwards wave labeled c pink does not fit well as a five wave structure on the 5 minute chart. Also, it seems unlikely that wave 4 blue would be as brief as 5 days. However, it is possible and we must consider it.
If price moves below 1,306.92 tomorrow then expect it to keep going downwards. At 1,278 wave (iii) green would reach 1.618 the length of wave (i) green. Wave (iii) green should take about a couple of sessions to unfold.
Wave 5 blue to end (1) black may find support about the lower edge of the wider blue parallel channel drawn on the daily chart.
When markets open tomorrow wave (ii) green may not move beyond the start of wave (i) green. This alternate would be invalidated with movement above 1,335.52, confirming our main wave count.
Alternate Daily Wave Count.
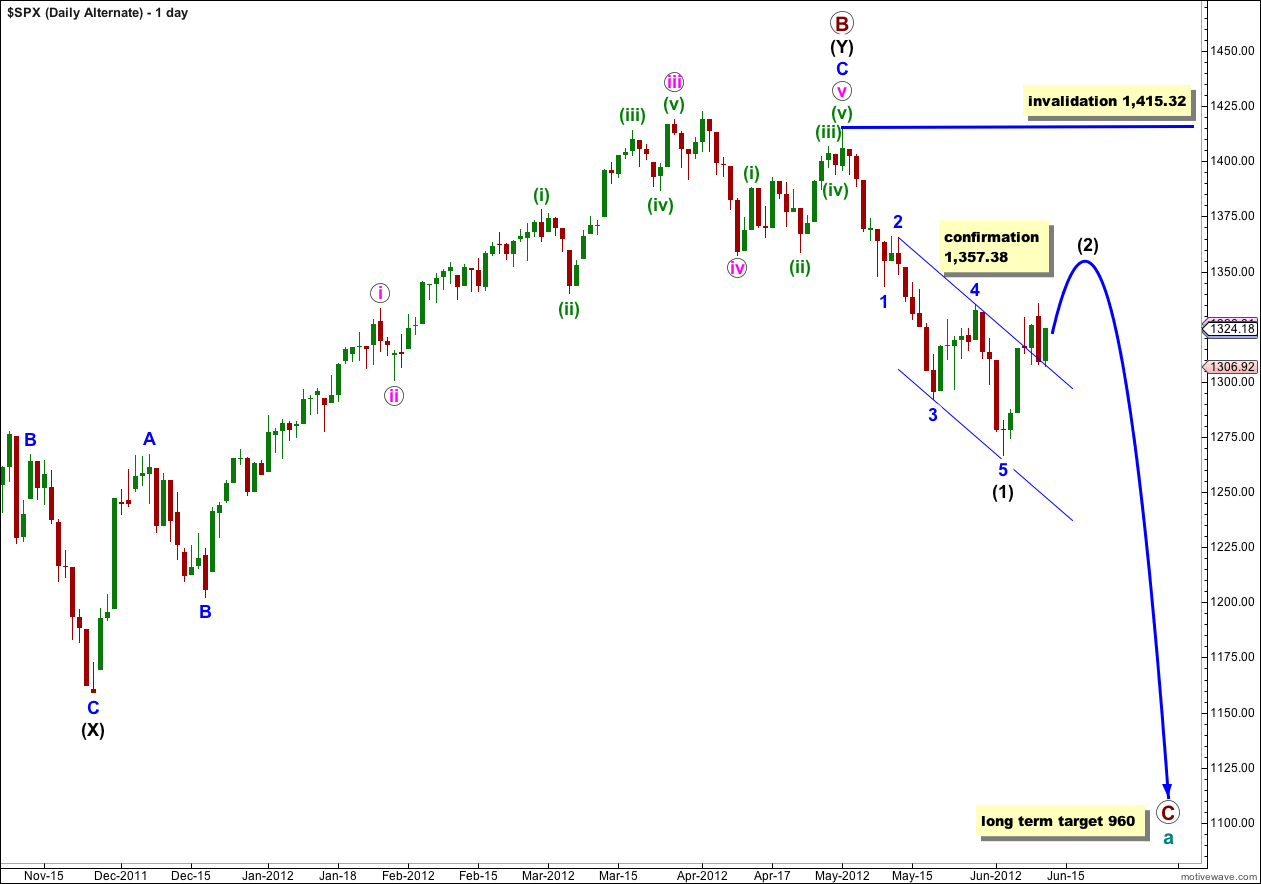
Primary wave B may have ended at 1,415.32 with a fifth wave truncation. The truncation reduces the probability of this alternate.
Wave (1) black is complete. This alternate now expects a second wave correction for wave (2) black. Wave (2) black can move right up to, but not above, 1,415.32.
This wave count diverges from our main wave count. The price point which differentiates the two is 1,357.38. The main wave count would not allow movement above that price point and this alternate sees it as reasonably likely. If price did move above 1,357.38 the main wave count would be invalidated and this alternate would be our sole wave count.
This alternate wave count expects a more long lasting and deeper correction than our main wave count. If this alternate is correct then intermediate wave (2) may last at least 4 weeks and possibly longer.
Wave (2) black may not move beyond the start of wave (1) black. This wave count is invalidated with movement above 1,415.32.
Looks like 1306.92 is still holding, but it looks like we started a 5 wave down too.
Could this be the end of Wave 4?
Thank you for your patience.
Hi Lara,
I am still learning to count the waves, I noticed based on your hourly chart, your pink IV to pink V was 5 waves down, and it was followed by another waves 5 up from pink V to pink a.
Just want to confirm, is that the way to count?
I thought 5 waves should be followed by 3 waves.
Thanks for taking time to clarify.
pink V subdivides into five at green degree
blue 4 subdivides into three at pink degree
that is why you have a five down for pink V followed by a five up for pink a
you are right, a five in one direction should be followed by a three in the opposite direction, and this is why wave 4 blue could not have been over at the high labeled a pink; that upwards wave was a five and not a three so it is an incomplete correction, it can only be wave a of the correction
be careful to compare the same wave degrees with each other, not one colour (degree) with another