
I had expected price to move higher during Monday’s session and a new high was made. However, although downwards movement remains above the invalidation point, the structure of most recent movement does not fit with the wave count. Downwards movement to end Monday’s session was allowed for, but it does not look like a low degree second wave correction.
I have a short term target for tomorrow’s session. The long term target is unchanged.
Click on the charts below to enlarge.
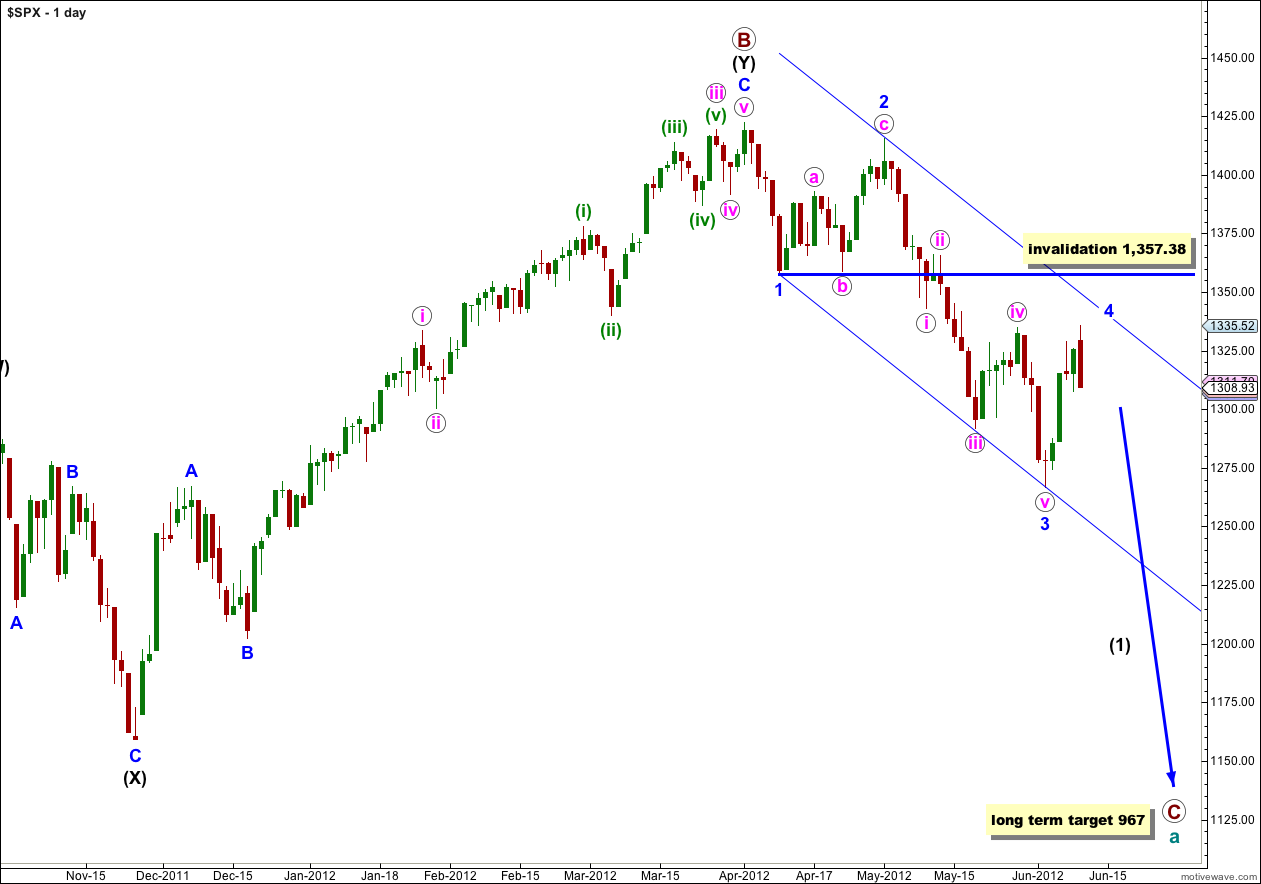
We have recently seen a very large trend change on the S&P 500 and a new downwards trend, to last months, has begun.
At cycle degree wave a (teal green) is an expanded flat correction. Primary wave A (maroon) within it subdivides into a three, and primary wave B is over 105% of primary wave A at 123%. The minimum requirements for an expanded flat are met. We should expect primary wave C to subdivide into a five and move price substantially below the end of primary wave A at 1,074.77.
At 967 primary wave C would reach 1.618 the length of primary wave A. If price continues through this first target, or it gets there and the structure is incomplete, then our second (less likely) target is at 685 where primary wave C would reach 2.618 the length of primary wave A.
Primary wave A lasted 4 months. Primary wave B lasted 6 months. We may expect primary wave C to last at least 4 months, if not longer.
Wave 3 blue is now complete. Wave 4 blue may not move into price territory of wave 1 blue. This wave count is invalidated with movement above 1,357.38.
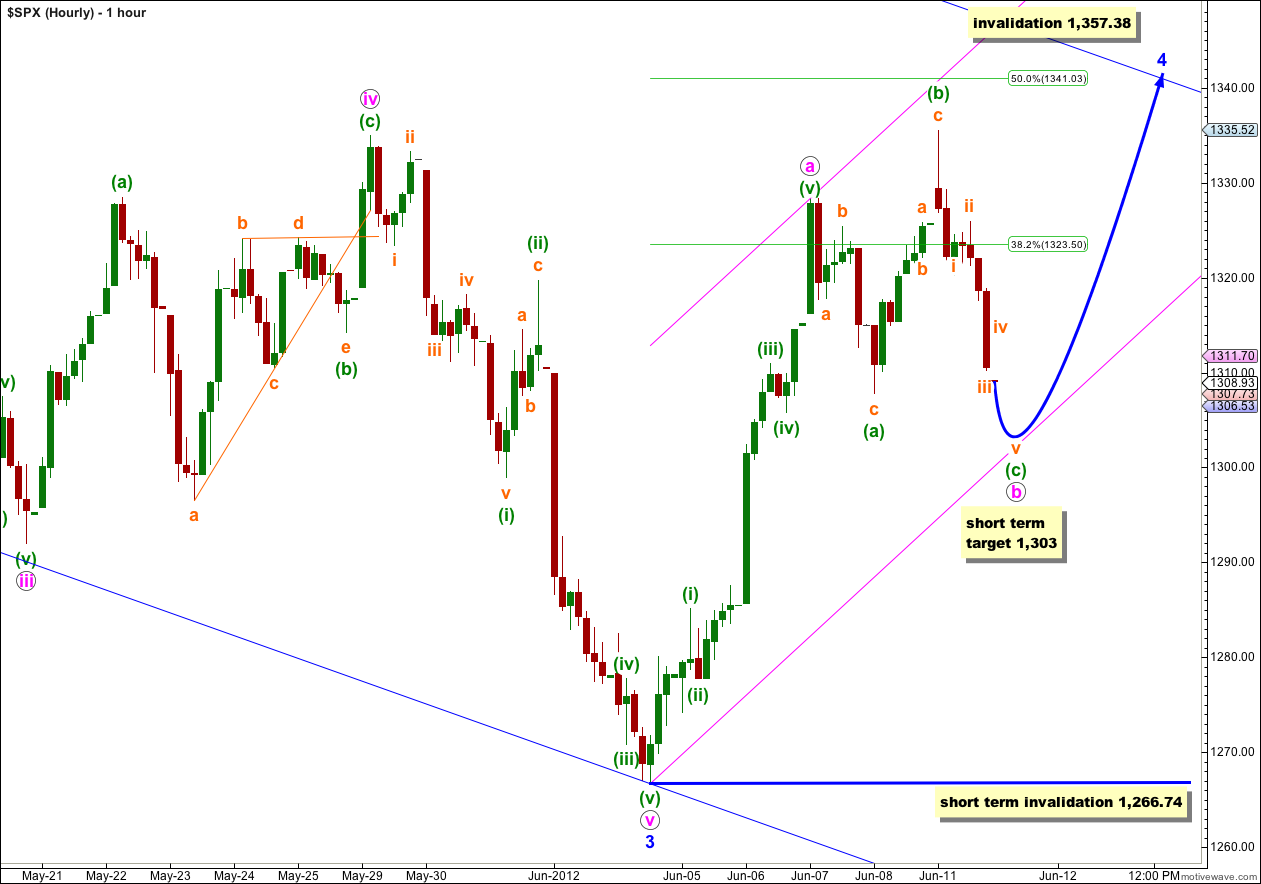
Monday’s session began with upwards movement, but it was not a low degree third wave as I had expected. Upwards movement created one more subwave changing what was previously an impulsive count into a corrective count. Upwards movement cannot be wave c pink unfolding, it must be a continuation of wave b pink.
Wave b pink within wave 4 blue is continuing further as a flat correction. Wave b pink is a 138% correction of wave a pink. At 1,303 wave c pink would reach 1.618 the length of wave a pink.
When wave b pink is over redraw the parallel channel about wave 4 blue. The point at which the mid line or upper edge of this channel intersects with the wider channel drawn on the daily chart may be the point at which wave 4 blue ends.
When markets open tomorrow we should see some downwards movement, which is highly likely to make a new low below (a) green at 1,307.77 to avoid a very rare running flat. Wave b pink may not move beyond the start of wave a pink. This wave count is invalidated with movement below 1,266.74.
With wave b pink taking longer to unfold the probability that wave 4 blue may be a single zigzag structure, and not a double, increases. I expect wave 4 blue to last another one to three weeks.
Alternate Daily Wave Count.
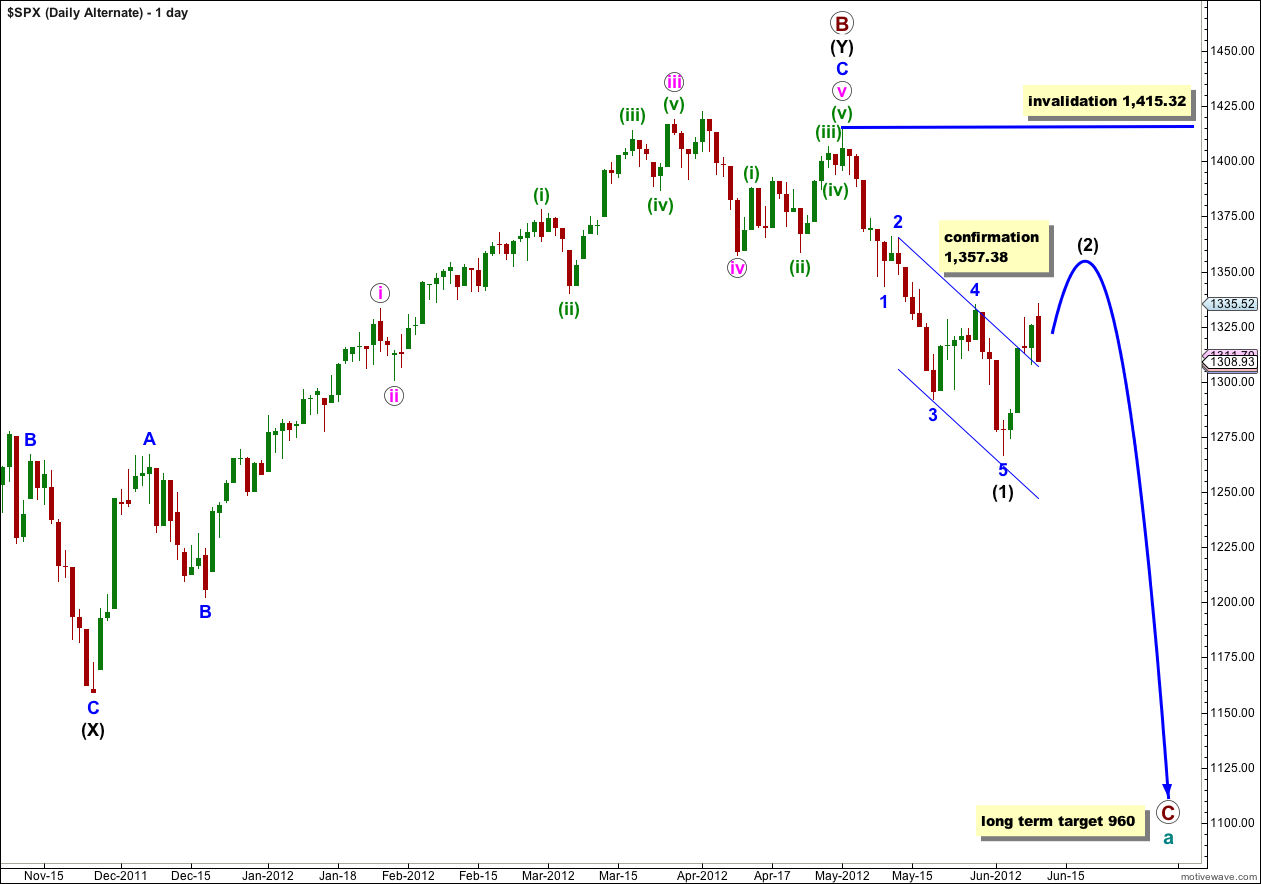
Primary wave B may have ended at 1,415.32 with a fifth wave truncation. The truncation reduces the probability of this alternate.
If primary wave C has more recently begun then it is probably within wave (1) black.
Wave (1) black is complete. This alternate now expects a second wave correction for wave (2) black. Wave (2) black can move right up to, but not above, 1,415.32.
This wave count now diverges from our main wave count. The price point which differentiates the two is 1,357.38. The main wave count would not allow movement above that price point and this alternate sees it as reasonably likely. If price did move above 1,357.38 the main wave count would be invalidated and this alternate would be our sole wave count.
This alternate wave count now expects a more long lasting and deeper correction than our main wave count. If this alternate is correct then intermediate wave (2) may last at least 4 weeks and possibly longer.
Wave (2) black may not move beyond the start of wave (1) black. This wave count is invalidated with movement above 1,415.32.
Lara,
Took off 1/2 at the EOD … nice ride
Thanks
Right-Angled and Descending Broadening Formations to start the move up.
Lara, my data shows we invalidated near the close at 1307.73. We also hit your target area of 1335 on the open. Why isn’t this the start of the first wave down?
because that last upwards wave has a corrective not an impulsive count, so it does not fit as a C wave to end the correction
also because that would make 4 blue remarkably brief at only 5 days
it’s possible, if my analysis of that last upwards wave I’ve labeled (b) green is wrong, that the correction is over, but I don’t think so
Hello Lara thank you for your great EW counts, I was wondering which data feed service are you using for the MW? thanks.
cheers, and you’re welcome Juan. I’m using BarCharts spx500 cash data feed.
Nice I am ready for this ride …