
Last analysis had a short term target for a little more downwards movement to begin Friday’s session at 1,311 to 1,309. The market opened with downwards movement which reached 1.23 points below the lower end of my target zone. Thereafter, as expected, price turned back upwards.
The target for this correction to end should be met early next week. Thereafter, I will have an alternate wave count which looks at the possibility this correction may continue as a double.
Click on the charts below to enlarge.
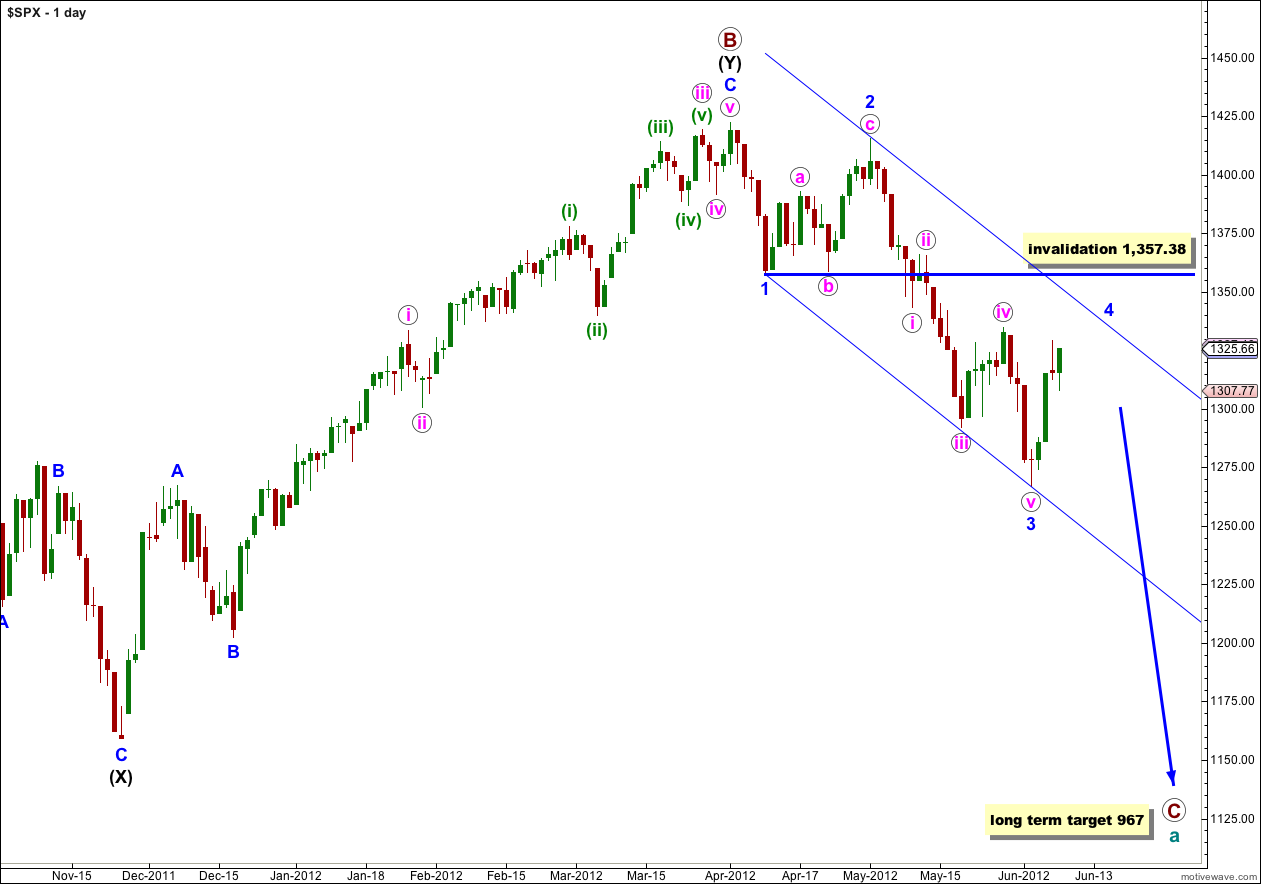
We have recently seen a very large trend change on the S&P 500 and a new downwards trend, to last months, has begun.
At cycle degree wave a (teal green) is an expanded flat correction. Primary wave A (maroon) within it subdivides into a three, and primary wave B is over 105% of primary wave A at 123%. The minimum requirements for an expanded flat are met. We should expect primary wave C to subdivide into a five and move price substantially below the end of primary wave A at 1,074.77.
At 967 primary wave C would reach 1.618 the length of primary wave A. If price continues through this first target, or it gets there and the structure is incomplete, then our second (less likely) target is at 685 where primary wave C would reach 2.618 the length of primary wave A.
Primary wave A lasted 4 months. Primary wave B lasted 6 months. We may expect primary wave C to last at least 4 months, if not longer.
Wave 3 blue is now complete. Wave 4 blue may not move into price territory of wave 1 blue. This wave count is invalidated with movement above 1,357.38.
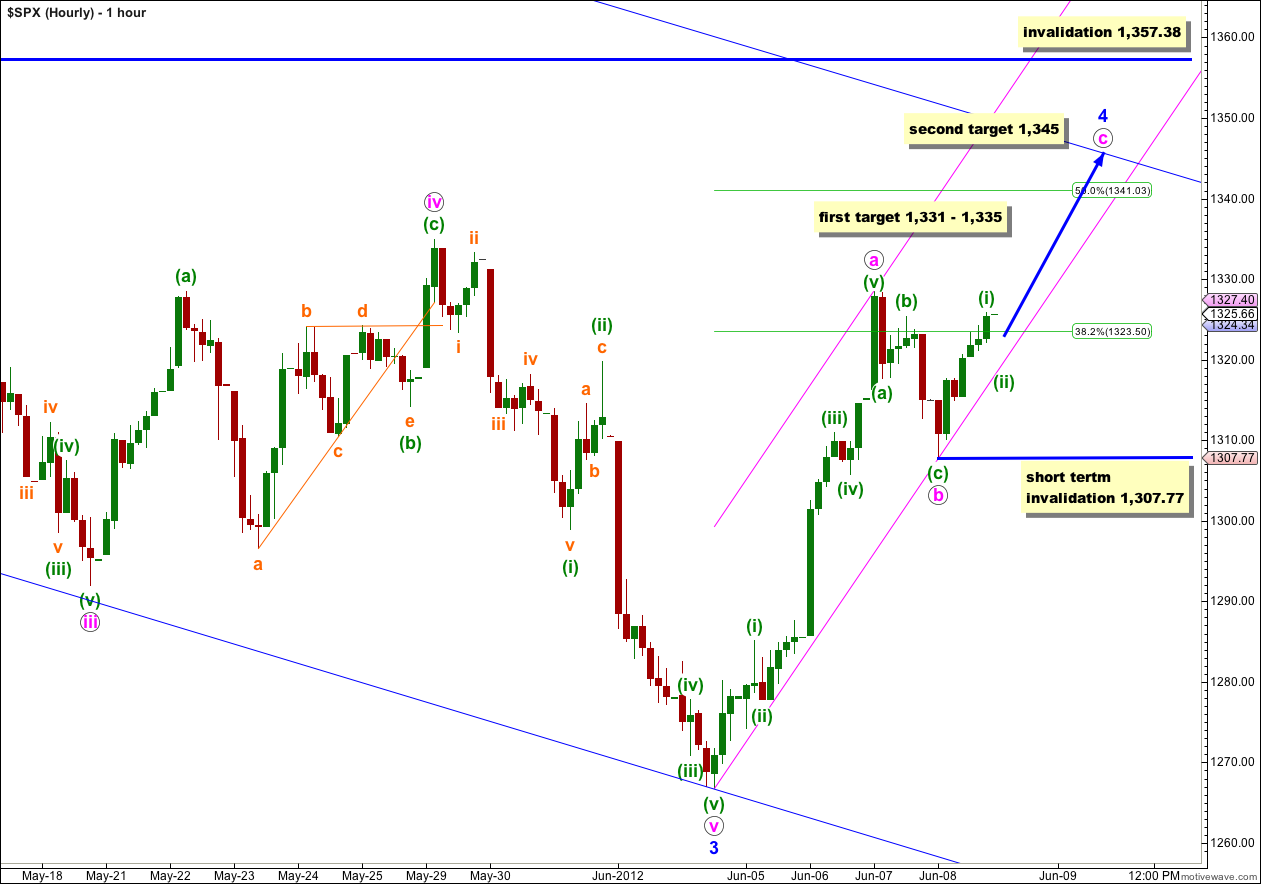
Wave b pink unfolded as a very clear three wave structure, which is a shallow 33% correction of wave a pink. Upwards movement which followed the end of wave b pink clearly breached the parallel channel drawn on the last hourly chart about wave b pink.
We can now use Elliott’s channeling technique to draw a parallel channel about the zigzag of wave 4 blue. Draw this channel from the start of wave a pink to the end of wave b pink, then place a parallel copy upon the high of wave a pink. Wave c pink may end mid way within this channel, or about the upper edge, where it intersects with the upper edge of the wider blue channel containing wave (1) black down (drawn on the daily chart).
At 1,331 wave c pink would reach 0.382 the length of wave a pink. This is only 4 points below the end of wave iv pink. This gives us the first target zone for wave c pink to end.
If price keeps rising through this first target zone, or if it gets there and the structure is incomplete, then the second target is at 1,345 where wave c pink would reach 0.618 the length of wave a pink.
When we have waves (i) through (iv) green complete within wave c pink I will also use Fibonacci ratios for waves at green degree to further refine the target for wave c pink to end.
When markets open on Monday we may see a little downwards movement for wave (ii) green. Wave (ii) green may not move beyond the start of wave (i) green. This wave count is invalidated with movement below 1,307.77.
On the 5 minute chart upwards movement ending Friday’s session has an impulsive count (it’s actually clearest on the 10 minute time frame). I have added my 5 minute chart for you to see how I see the breakdown of this movement. We may be fairly confident that wave b pink is over and wave c pink is underway.
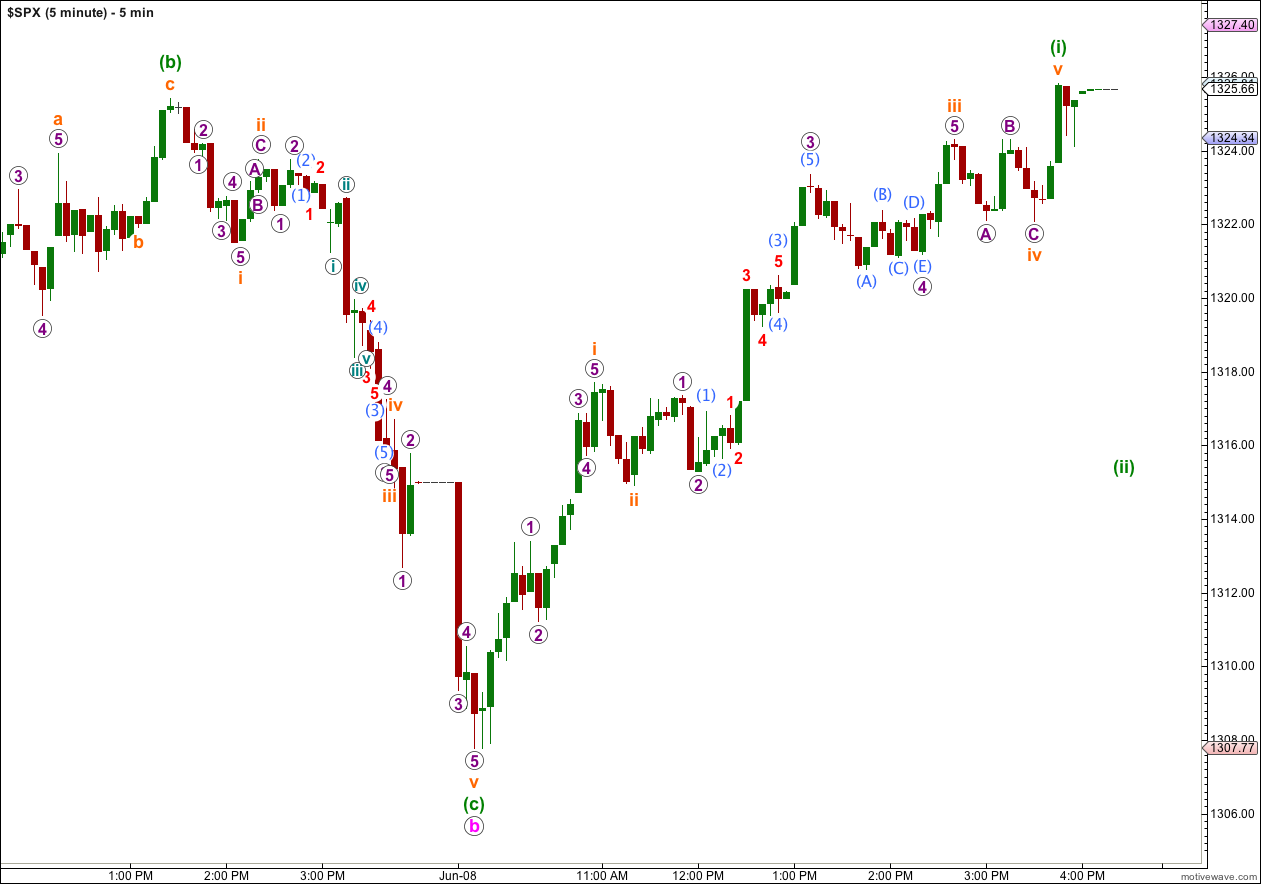
Within this upwards movement at the end of Friday’s session I can see a perfect 5 wave impulse. Wave iii orange is just 0.56 points shorter than equality with wave i orange, and wave v orange is just 0.06 points short of 0.382 the length of wave i orange. I will expect a little more downwards movement for wave (ii) green to complete when the markets open on Monday morning.
Alternate Daily Wave Count.
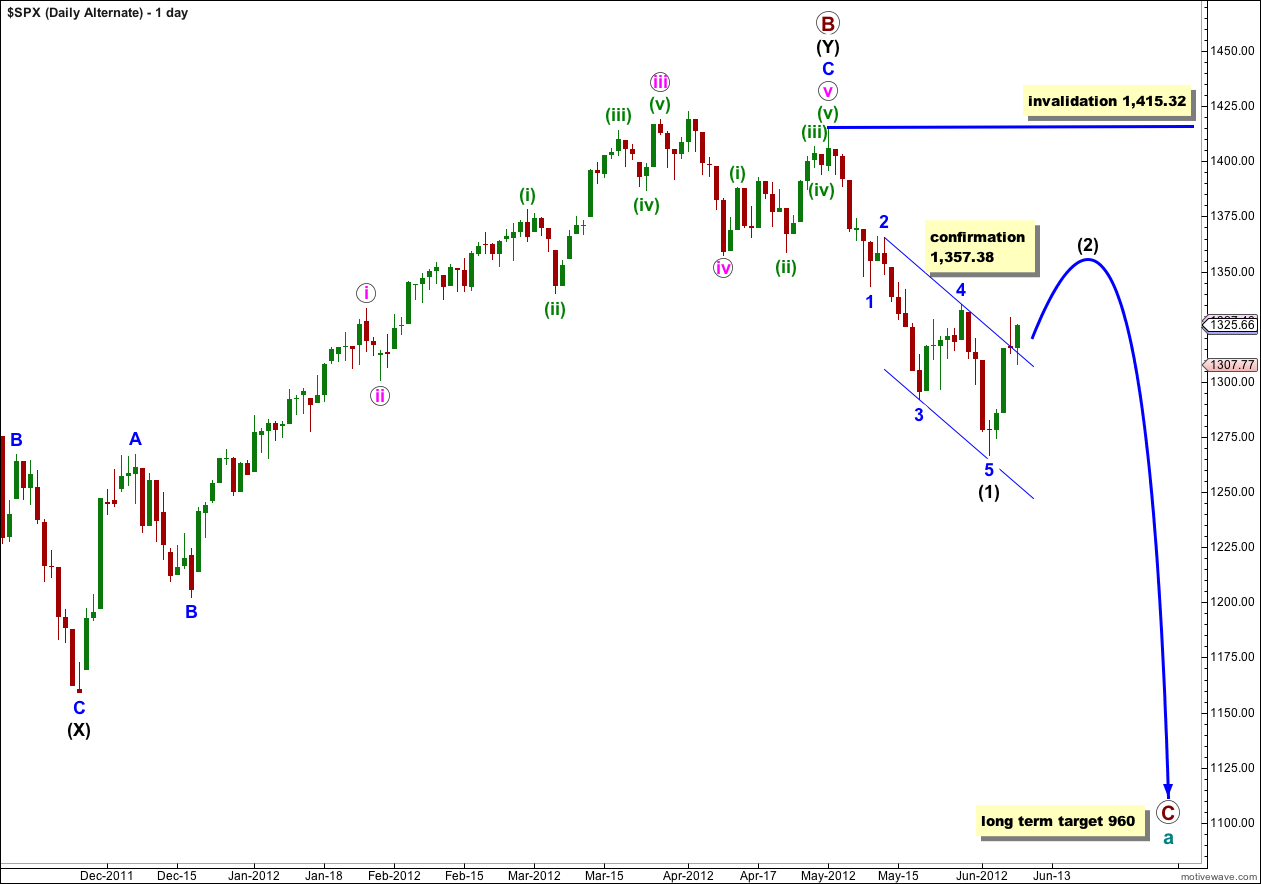
Primary wave B may have ended at 1,415.32 with a fifth wave truncation. The truncation reduces the probability of this alternate.
If primary wave C has more recently begun then it is probably within wave (1) black.
Wave (1) black is complete. This alternate now expects a second wave correction for wave (2) black. Wave (2) black can move right up to, but not above, 1,415.32.
This wave count now diverges from our main wave count. The price point which differentiates the two is 1,357.38. The main wave count would not allow movement above that price point and this alternate sees it as reasonably likely. If price did move above 1,357.38 the main wave count would be invalidated and this alternate would be our sole wave count.
This alternate wave count now expects a more long lasting and deeper correction than our main wave count. If this alternate is correct then intermediate wave (2) may last at least 4 weeks and possibly longer.
Wave (2) black may not move beyond the start of wave (1) black. This wave count is invalidated with movement above 1,415.32.
ES 1297 went long … a good point for a Wave 2 up into SPX 1315.00 then I think we could start Wave 3 down again.
What do you think.
next analysis is almost published, that will illustrate what I think 🙂
Looking more like a flat or contracting triangle set-up … with IHS ??
With this sell off looks like wave 4 is over too??
looks like an expanded flat to me
How high … is the goal the same?
What do you think about a 20 point gap up tonight?
ES 1342.00 I shorted it for now..
quite likely.
i’m expecting price to go up (after a second wave correction) on Monday
Covered a lot of the shorts … looking for the new high.