
I had expected Thursday’s session to begin with a little upwards movement, but not as much as we saw. The very short term target of 1,318.50 was well exceeded. Thereafter, I expected downwards movement in a clear three wave structure which is what we have so far.
The first wave of this correction is now clearly complete, and the next wave is nearing completion. I can now have a firmer idea of what structure may unfold. In one more session I may be able to provide a stronger target for it to end, but for now I leave the somewhat wide target zone as a rough guideline.
I will expect this correction to find resistance at the upper edge of the parallel channel drawn on both daily and hourly charts.
Click on the charts below to enlarge.
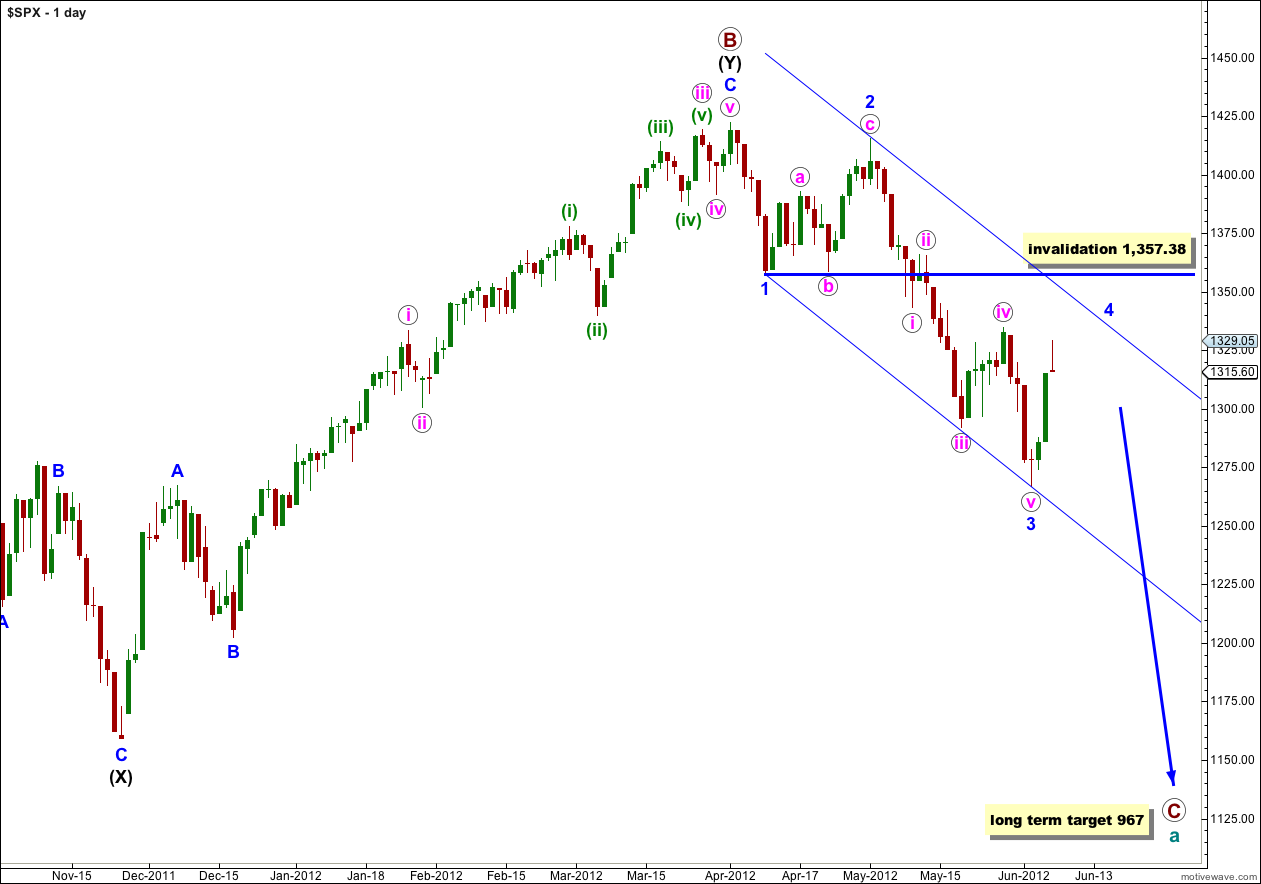
We have recently seen a very large trend change on the S&P 500 and a new downwards trend, to last months, has begun.
At cycle degree wave a (teal green) is an expanded flat correction. Primary wave A (maroon) within it subdivides into a three, and primary wave B is over 105% of primary wave A at 123%. The minimum requirements for an expanded flat are met. We should expect primary wave C to subdivide into a five and move price substantially below the end of primary wave A at 1,074.77.
At 967 primary wave C would reach 1.618 the length of primary wave A. If price continues through this first target, or it gets there and the structure is incomplete, then our second (less likely) target is at 685 where primary wave C would reach 2.618 the length of primary wave A.
Primary wave A lasted 4 months. Primary wave B lasted 6 months. We may expect primary wave C to last at least 4 months, if not longer.
Wave 3 blue is now complete. Wave 4 blue may not move into price territory of wave 1 blue. This wave count is invalidated with movement above 1,357.38.
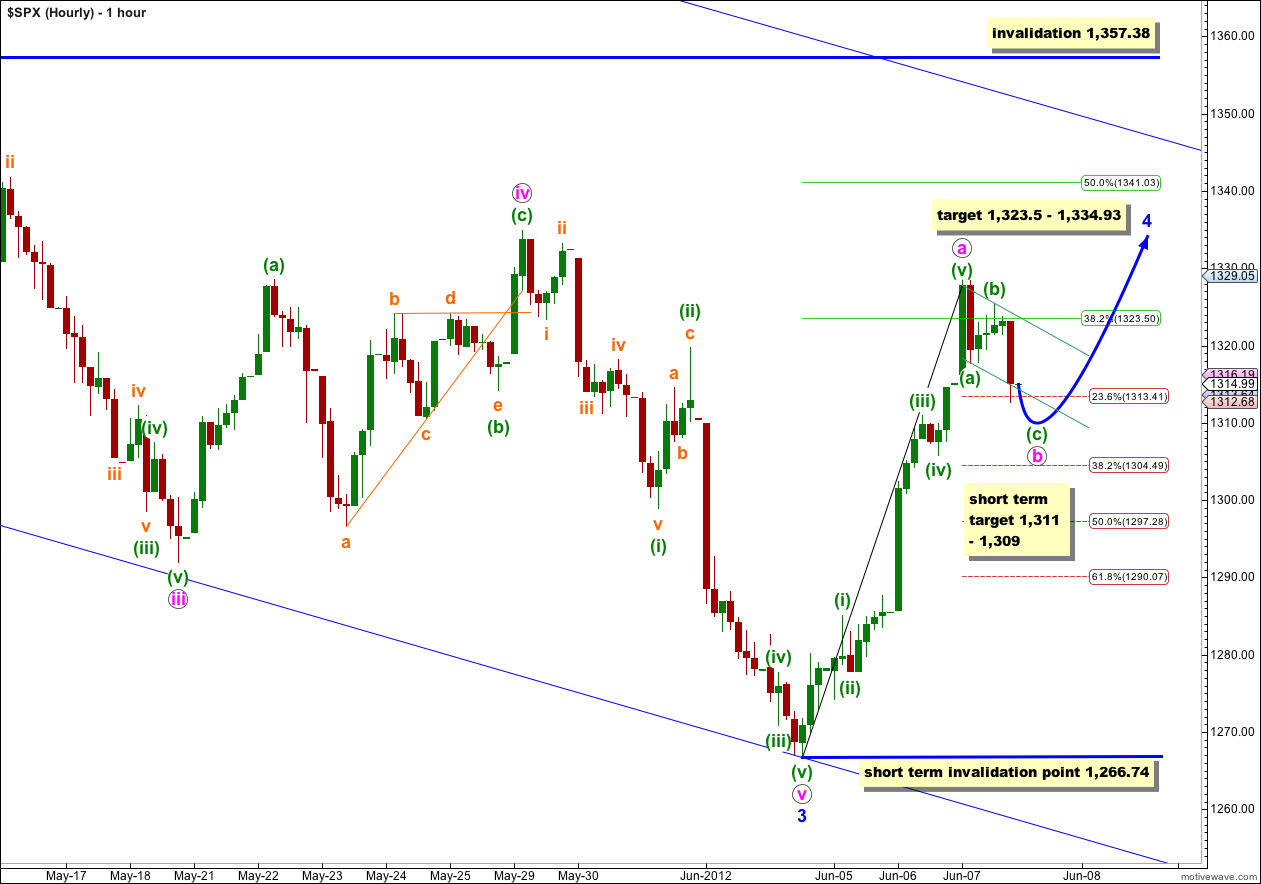
The very short term target of 1,318.50 for a small amount of upwards movement was well exceeded. Wave (v) green moved considerably higher before ending, and is now 1.46 points longer than 0.618 the length of wave (iii) green. There is no Fibonacci ratio between waves (i) and (iii) green.
A small channel drawn about wave a pink (not shown on the chart above for clarity’s sake) is clearly breached by downwards movement confirming wave a pink impulse is over and wave b pink downwards is now underway.
Wave b pink is unfolding as a very clear three wave structure exactly as expected. Within it, on the 5 and 1 minute charts, wave (c) green looks almost complete–the very last fifth wave within it needs to complete its last fifth wave. We may see a little downwards movement tomorrow when markets open. At 1,309 wave (c) green would reach 1.618 the length of wave (a) green. At 1,311 wave v orange within wave (c) green (seen on a 5 minute chart) would reach 0.618 the length of wave iii orange. This gives us a small 3 point target zone for a little more downwards movement tomorrow.
I have used Elliott’s technique to draw a small channel about wave b pink. When this channel is breached by upwards movement look at the upwards movement on a 5 minute chart. If you can see a clear 5 up (an impulsive count of 5, 9, 13, 17 etc as opposed to a corrective count of 3, 7, 11, 15 etc) then you may expect that wave b pink is over and wave c pink is underway. Wave c pink is extremely likely to make a new high above the end of wave a pink at 1,329.05 to avoid a truncation.
When wave b pink is complete draw a parallel channel about wave 4 blue. Draw the first trend line from the start of wave 4 blue to wherever wave b pink ends, then place a parallel copy on the high of wave a pink. Wave c pink may end about the upper edge of such a channel, and if that point intersects with the upper edge of the wide blue parallel channel containing wave (1) black downwards then that would be a likely place for wave 4 blue to end.
On the daily chart wave 4 blue has lasted only 3 days and looks to be too brief given that wave 2 blue lasted 15 days (3 weeks). For this reason I will consider a possible double zigzag or double combination unfolding. When this first zigzag is complete I will publish an alternate which moves everything within the correction of 4 blue down one degree. This first zigzag may be only the first of two structures within wave 4 blue, and a second structure may follow which would be either a zigzag, flat or triangle.
Tomorrow when markets open further downwards movement for wave b pink may not move beyond the start of wave a pink. This wave count is invalidated with movement below 1,266.74 in the short term.
Wave 4 blue may not enter wave 1 blue price territory. This wave count is invalidated with movement above 1,357.38.
Alternate Daily Wave Count.
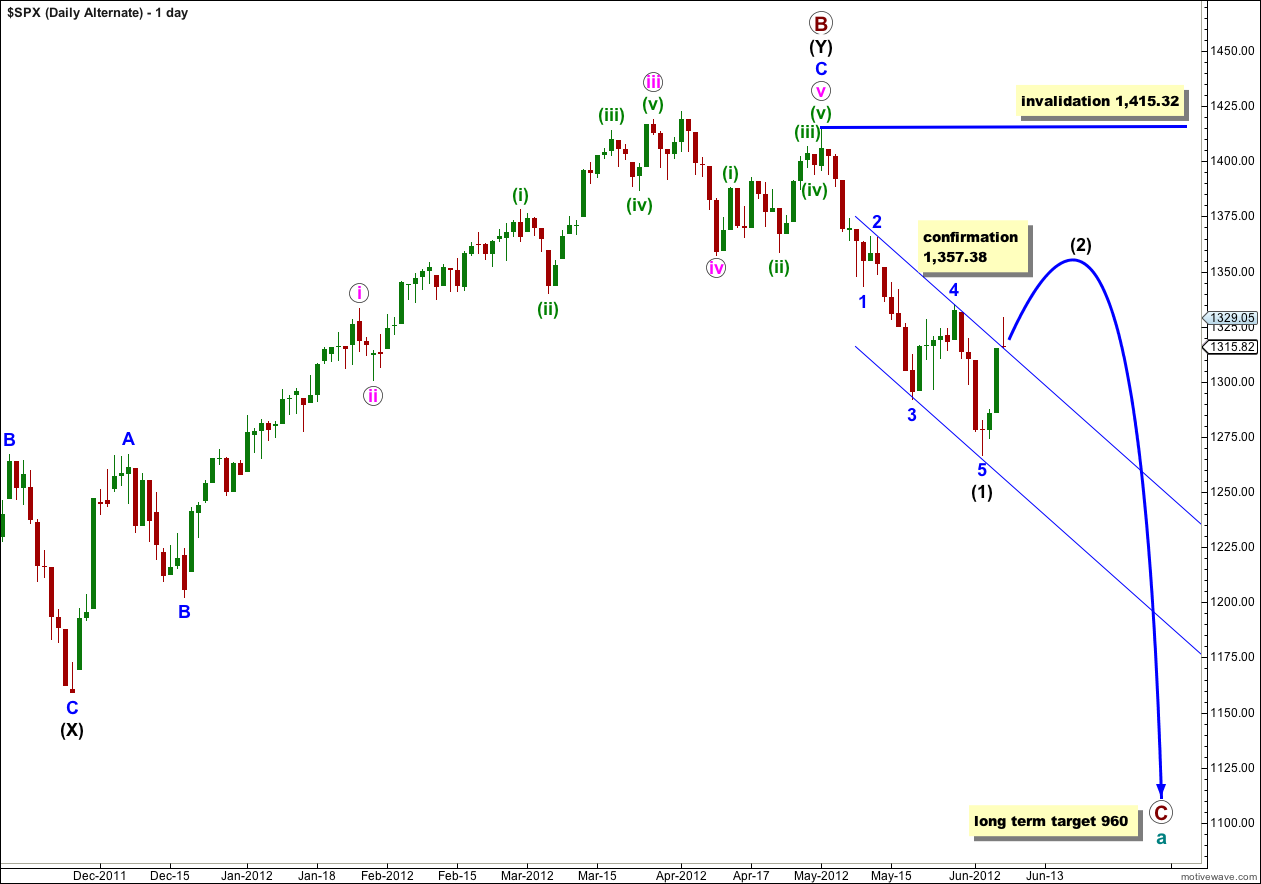
Primary wave B may have ended at 1,415.32 with a fifth wave truncation. The truncation reduces the probability of this alternate.
If primary wave C has more recently begun then it is probably within wave (1) black.
Wave (1) black is complete. This alternate now expects a second wave correction for wave (2) black. Wave (2) black can move right up to, but not above, 1,415.32.
This wave count now diverges from our main wave count. The price point which differentiates the two is 1,357.38. The main wave count would not allow movement above that price point and this alternate sees it as reasonably likely. If price did move above 1,357.38 the main wave count would be invalidated and this alternate would be our sole wave count.
This alternate wave count now expects a more long lasting and deeper correction than our main wave count. If this alternate is correct then intermediate wave (2) may last at least 4 weeks and possibly longer.
Wave (2) black may not move beyond the start of wave (1) black. This wave count is invalidated with movement above 1,415.32.
Thanks… your historic monthly as of April will do.
you will find this under the S&P500 Historic Analysis;
http://elliottwavestockmarket.com/2012/04/02/sp-500-elliott-wave-technical-analysis-long-term-monthly-charts/#more-24808
Laura,
Do you have a chart that shows the Primary 1 through the Primary C wave counts target of 967. I would like to look at the S&P chart over that period.
Edwin
Primary C has only begun and the target at 967 has not been reached so I cannot show you a chart for that period, it does not exist yet.
I wish I could. That sure would make my job easier!
Take a look at the historic analysis monthly charts. If there are any specific periods you want a break down for on a daily chart let me know and I’ll email it to you.
We sold everything today …. and started shorting very heavy will add more if it can go higher.
EMA(34) 1332.70 great set-up like last Aug to Oct — very cool.
That is one big IHS with a neck line in the 1297 area … once over your upper channel line 1350 area … do not see 1422 holding very long. Once we get done with this b Wave next week.