
Movement above 1,298.90 has invalidated my hourly wave count. Upwards movement is still corrective, but it is two degrees higher than I had it.
I was expecting a larger more time consuming correction to arrive but I expected it to arrive next week, not this week. It must be here early.
At the daily chart level both wave counts look very good and remain valid. This is the point at which they diverge and I will use the price point which differentiates the two to see which one is correct.
Click on the charts below to enlarge.
We have recently seen a very large trend change on the S&P 500 and a new downwards trend, to last months, has begun.
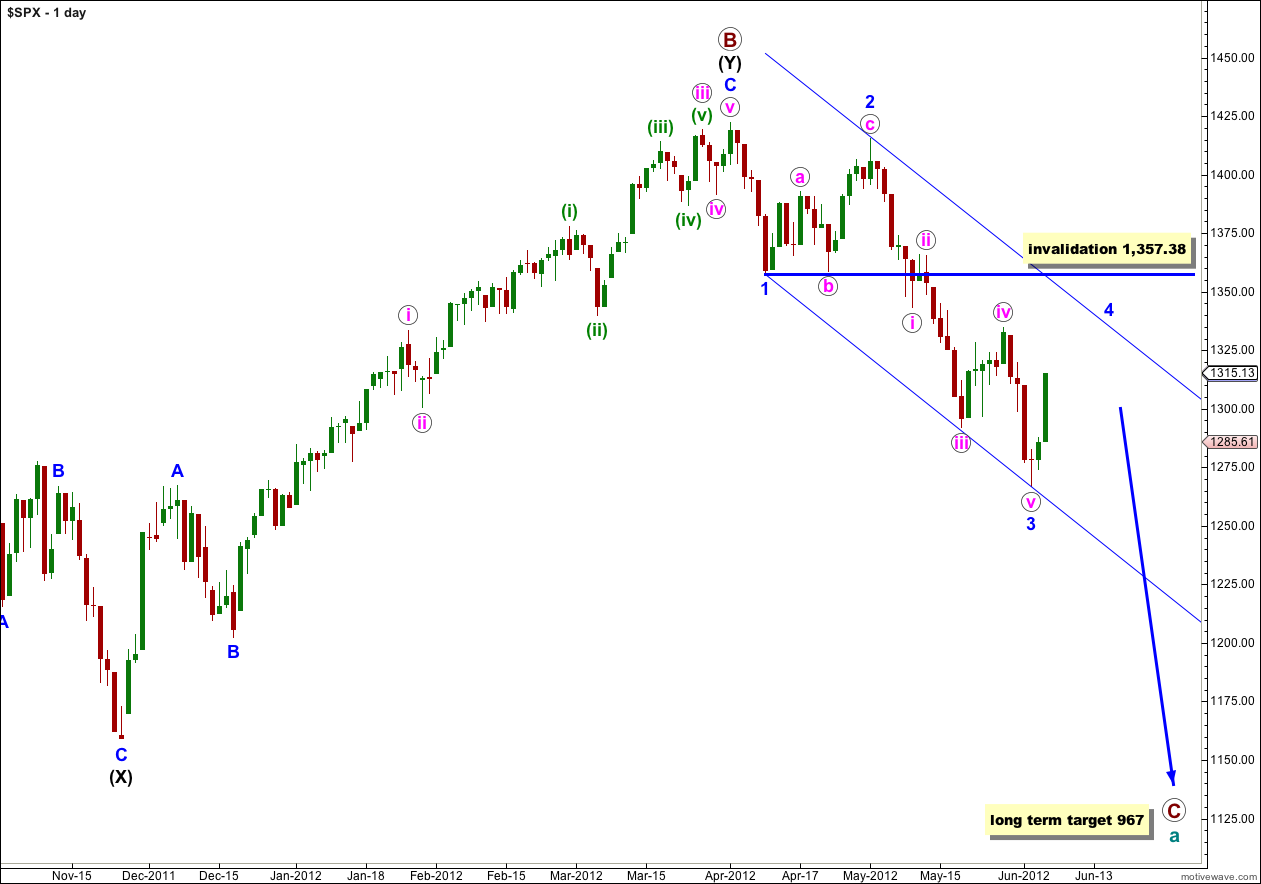
At cycle degree wave a (teal green) is an expanded flat correction. Primary wave A (maroon) within it subdivides into a three, and primary wave B is over 105% of primary wave A at 123%. The minimum requirements for an expanded flat are met. We should expect primary wave C to subdivide into a five and move price substantially below the end of primary wave A at 1,074.77.
At 967 primary wave C would reach 1.618 the length of primary wave A. If price continues through this first target, or it gets there and the structure is incomplete, then our second (less likely) target is at 685 where primary wave C would reach 2.618 the length of primary wave A.
Primary wave A lasted 4 months. Primary wave B lasted 6 months. We may expect primary wave C to last at least 4 months, if not longer.
Wave 3 blue is now complete. Wave 4 blue may not move into price territory of wave 1 blue. This wave count is invalidated with movement above 1,357.38.
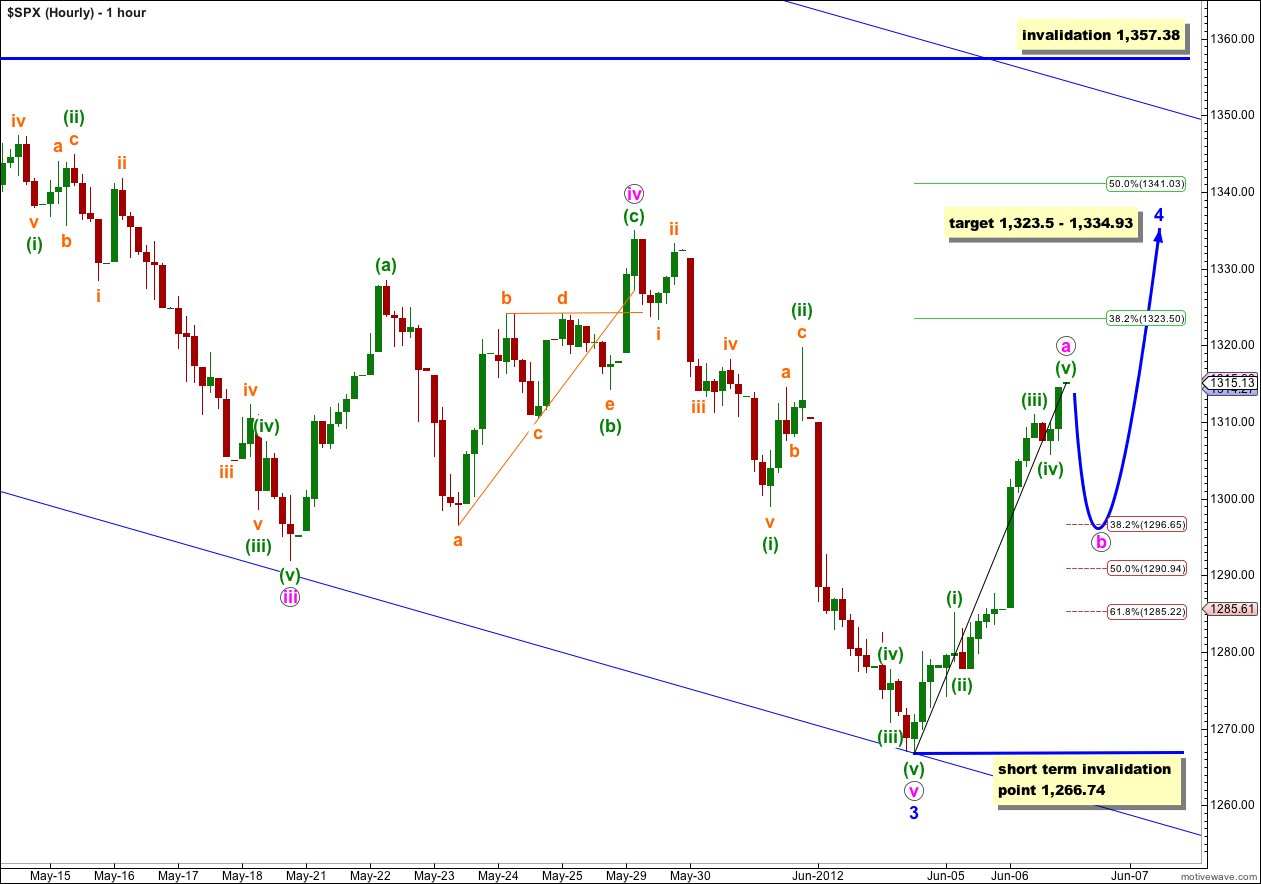
Upwards movement cannot be wave (iv) green, as labeled for yesterday’s analysis, and it must be wave 4 blue, at two degrees higher. I was expecting this fourth wave to arrive next week after one final push to a new low, but it is here earlier than expected.
The piece of analysis which I had wrong was the end of wave v pink. Wave (iv) green within it must have already been over and somewhat out of proportion to its counterpart wave (ii) green, giving this fifth wave a slightly odd look. However, on the 5 minute chart I can see all subdivisions correct and complete, even if the proportions are odd.
Wave 3 blue has no Fibonacci ratio with wave 1 blue. When wave 5 blue arrives I will then expect it to be extremely likely to exhibit a Fibonacci ratio to either of 1 or 3 blue.
Ratios within wave 3 blue are: wave iii pink is just 1.71 points longer than wave i pink, and wave v pink 4 points short of equality with wave i pink.
Ratios within wave v pink are: wave (iii) green has no Fibonacci ratio to wave (i) green, and wave (v) green is 0.53 points short of 0.236 the length of wave (iii) green.
Wave 2 blue lasted 15 days (3 weeks). We may expect wave 4 blue to last at least a week, and possibly up to 4. It really depends upon the structure it unfolds as, and at this stage it is much too early to know which structure that may be.
Wave 2 blue was a deep flat 89% correction of wave 1 blue. Given the guideline of alternation we may expect wave 4 blue to be relatively shallow and we may favour the 0.382 Fibonacci ratio of wave 3 blue at 1,323.50.
Fourth waves often end about the same level as the fourth wave of one lesser degree. Wave 4 blue may end about the high labeled wave iv pink at 1,334.93.
When we have waves a and b pink clearly complete with wave 4 blue at that stage I will be able to calculate a smaller target for wave 4 blue to end. At this early stage we can only have this somewhat wide target zone as a rough guideline.
At this stage, so far, upwards movement looks impulsive and may be a five wave structure for wave a pink. This would indicate a zigzag unfolding for either the entire structure of wave 4 blue or maybe only the first structure of a double for wave 4 blue.
Within wave a pink there are no Fibonacci ratios between waves (i), (iii) and (v) green. This makes me suspicious that wave (v) green is incomplete. If it moved slightly higher to 1,318.50 wave (v) green would be 0.382 the length of wave (iii) green. I think because of this that to start tomorrow’s session we will see a little more upwards movement to complete wave a pink.
When wave a pink is complete we should expect a three wave structure downwards for wave b pink. Because wave a pink subdivides into a five wave b pink may not move beyond its start. This wave count is invalidated in the short term with movement below 1,266.74.
(There is a very small possibility that wave b pink could move below 1,266.74, if wave 4 blue unfolds as a running triangle and wave a pink within it is an impulse. The probability of this is very low because wave A within a triangle is normally a zigzag.)
We should expect choppy overlapping movement and new highs over the next one to four weeks.
Wave 4 blue may not move into wave 1 blue price territory. This wave count is invalidated with movement above 1,357.38.
Alternate Daily Wave Count.
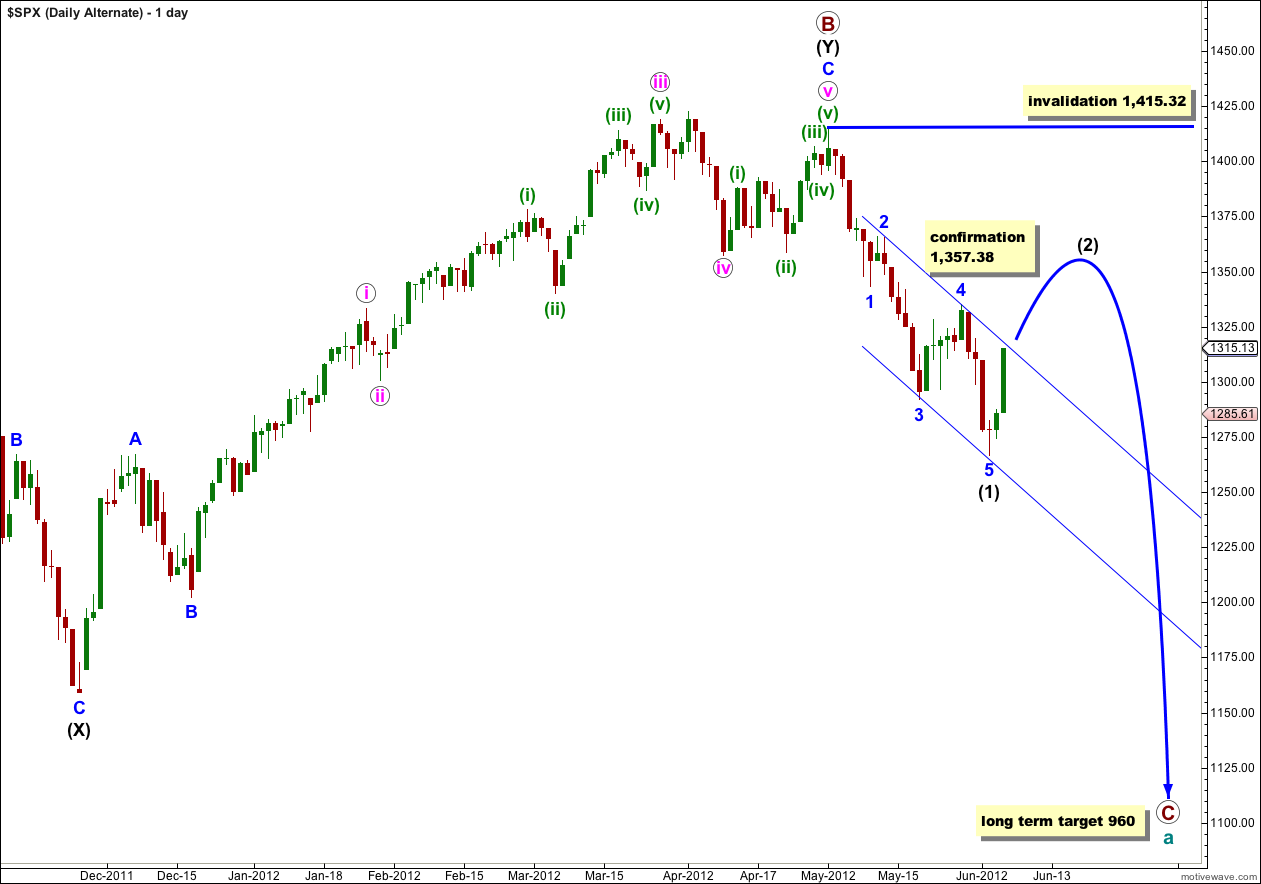
Primary wave B may have ended at 1,415.32 with a fifth wave truncation. The truncation reduces the probability of this alternate.
If primary wave C has more recently begun then it is probably within wave (1) black.
Wave (1) black is complete. This alternate now expects a second wave correction for wave (2) black. Wave (2) black can move right up to, but not above, 1,415.32.
This wave count now diverges from our main wave count. The price point which differentiates the two is 1,357.38. The main wave count would not allow movement above that price point and this alternate sees it as reasonably likely. If price did move above 1,357.38 the main wave count would be invalidated and this alternate would be our sole wave count.
This alternate wave count now expects a more long lasting and deeper correction than our main wave count. If this alternate is correct then intermediate wave (2) may last at least 4 weeks and possibly longer.
Wave (2) black may not move beyond the start of wave (1) black. This wave count is invalidated with movement above 1,415.32.
The Australian $/U.S.$ ratio has a decent track record for future S&P 500 moves. On 3/29 this currency ratio was suggesting at least a 7% decline in the S&P 500 should take place (see 7% decline posting) and the S&P 500 declined a little more than that from high to the recent lows.
The chart below is an update to this ratio, reflecting that each time the ratio hit a certain price level since 2010, the S&P 500 has rallied at least 13%. http://blog.kimblechartingsolutions.com/wp-content/uploads/2012/06/audusd13percentrallyjune7.gif
Thanks Lara.
Hi Lara,
Based on your 05 June hourly chart, have you considered an ending diagonal since we are going into wave (5), which means blue 3 could still end next week.
and wave (v) pink, 3 blue lower than 1266, correct ?
Hi Trieder,
Yes treider_, I was am just considering the possibilities. Plus, I am not really sure how to qualify ending diagonals.
In any case, using Lara’s main count and the possibility of ending diagonal, then the market has to go down tonight. Only difference is the end point.
If further upward push, then the market is rebounding.
No, because an ending diagonal requires all subwaves to be zigzags. The first wave is such a clear impulse.
I guess it’s technically possible if only waves (i) and half of (ii) green of a possible ending diagonal are complete, but that would look very strange on the daily chart.
Lara ,thanks for clarifying. Where could I see your current monthly chart?
Hi! Lara,
Are these wave labels for Minor 1 for five days , Minor 2 lasting 15 days and so forth one degree too high?
In the past I have never seen Minor 1 lasting just for 5 days?
This drop is similar to 2007 drop and it took 31 days for Minor 1 and 11 days for minor 2 to finish?
Intermediate Wave (1) took total 101 Days to finish.
Regards,
Sandy
You may be right. After this correction is over and the next wave down shows us how long it is I may move everything down one degree.
However, this wave count does already have minor waves which are briefer than weeks (the guideline for their duration):
Within primary wave A from it’s start at 1,356.48 on 7th July, 2011: within intermediate (A) five wave impulse minor 1 lasted 7 days, minor 2 lasted just 3 days, minor 3 lasted 13 days, minor 4 lasted 6 days and minor 5 lasted 3 days. Intermediate (A) lasted 32 days.
I did have everything one degree lower and just a couple of weeks ago have moved everything up one degree after looking at wave sizes and durations on the monthly chart.
At the start of movements one of the most difficult decisions is what degree to label everything. Often it is only clear towards the middle of a movement.
Durations are a guideline only anyway.
Hi Lara,
Under your main daily wave count, is it possible that the end of wave 3 blue have been the end of wave 1 black ?
Thanks
Dave
no, because that movement subdivides into three not five