
Yesterday’s analysis stated “for the next one or two sessions we should expect choppy, overlapping and slightly higher movement” with a short term target for a little upwards movement at 1,286. Price reached just 1.62 points above this target to 1,287.62 during Tuesday’s session.
I have still just the one hourly wave count for you. This hourly chart will suffice for both daily wave counts, which still do not diverge at this stage.
Click on the charts below to enlarge.
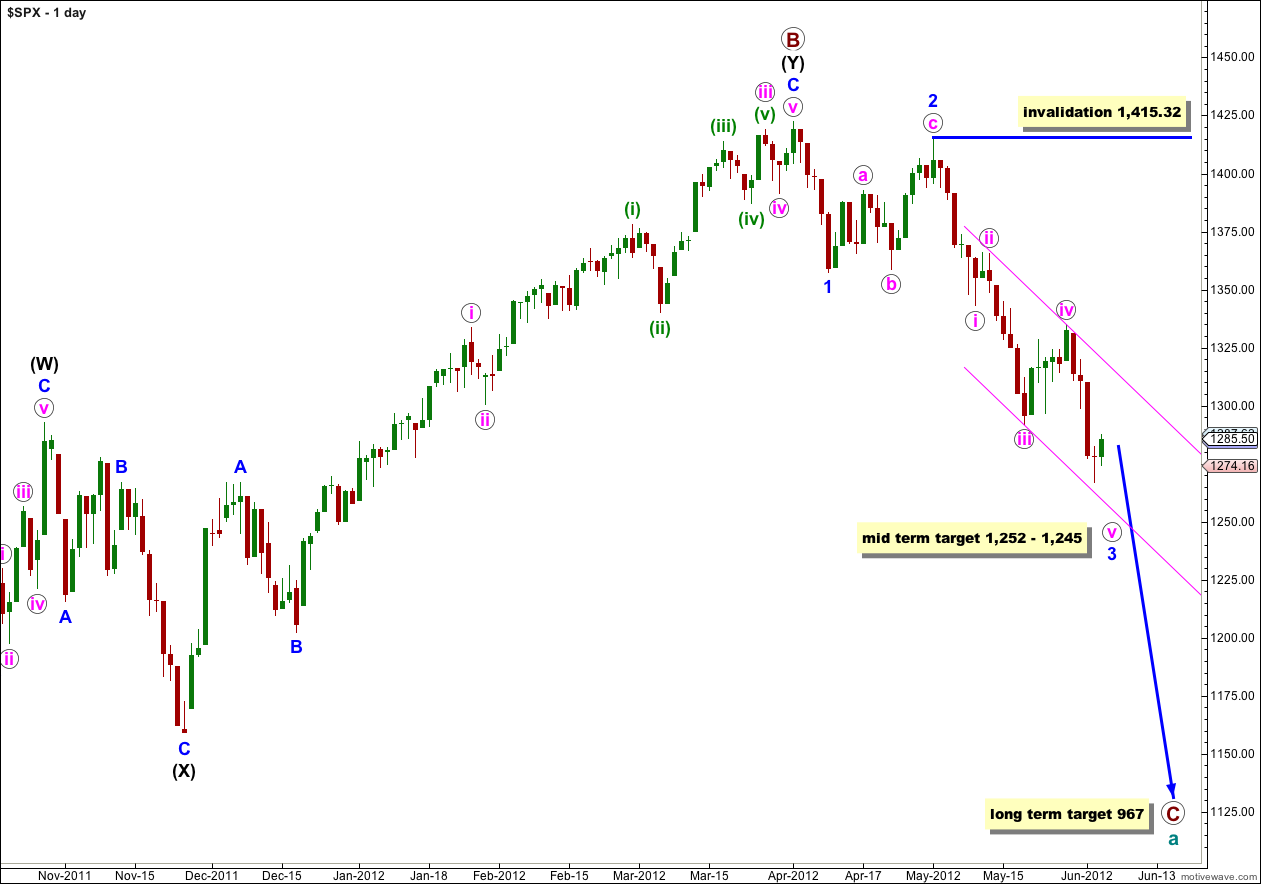
We have recently seen a very large trend change on the S&P 500 and a new downwards trend, to last months, has begun.
At cycle degree wave a (teal green) is an expanded flat correction. Primary wave A (maroon) within it subdivides into a three, and primary wave B is over 105% of primary wave A at 123%. The minimum requirements for an expanded flat are met. We should expect primary wave C to subdivide into a five and move price substantially below the end of primary wave A at 1,074.77.
At 967 primary wave C would reach 1.618 the length of primary wave A. If price continues through this first target, or it gets there and the structure is incomplete, then our second (less likely) target is at 685 where primary wave C would reach 2.618 the length of primary wave A.
Primary wave A lasted 4 months. Primary wave B lasted 6 months. We may expect primary wave C to last at least 4 months, if not longer.
Within wave 3 blue no second wave correction may move beyond the start of the first wave. This wave count is invalidated with movement above 1,415.32. When the structure of wave 3 blue is complete then the invalidation point can be moved to the low of wave 1 blue at 1,357.38.
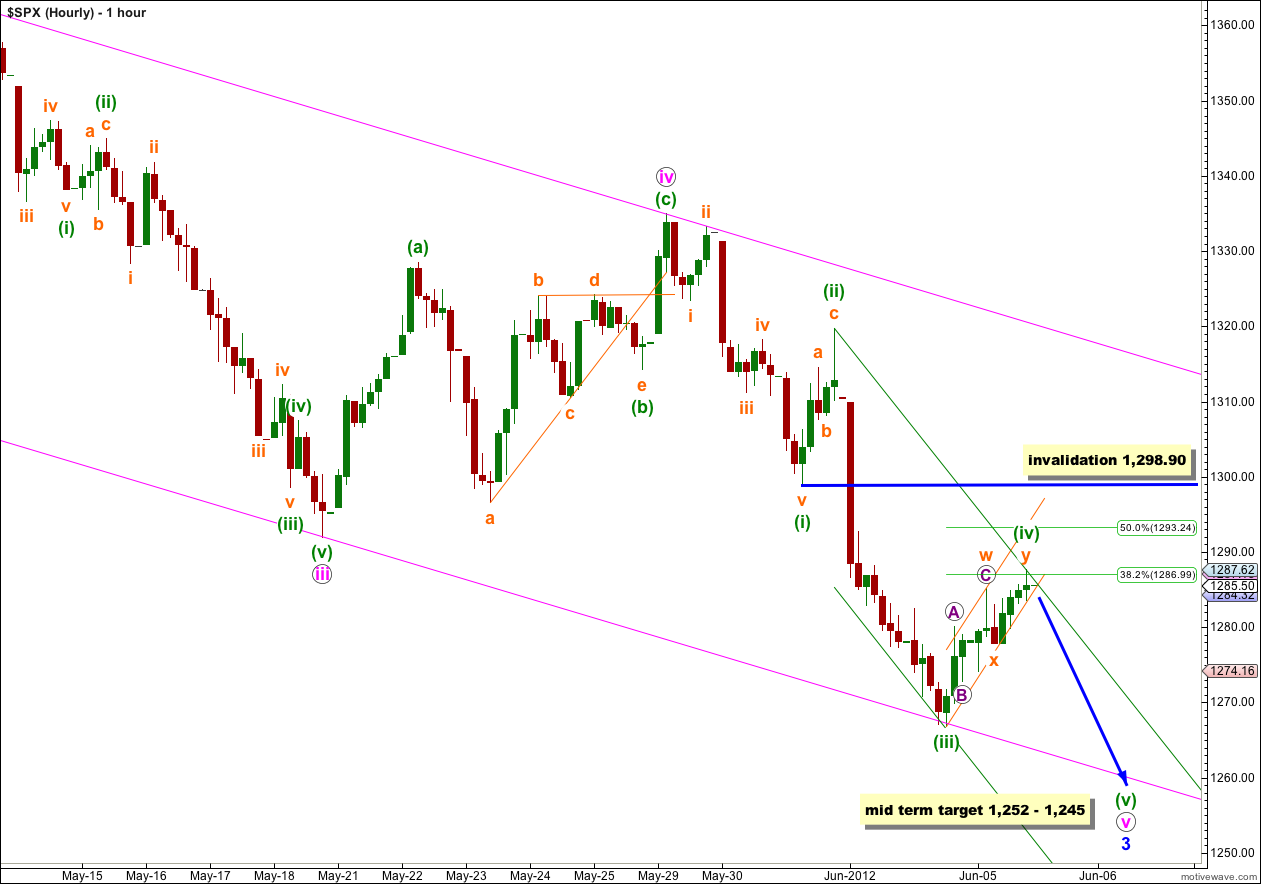
The first zigzag within wave (iv) green is now complete, but the correction is not over. Wave (iv) green is continuing further as a double zigzag (so far) which will nicely achieve alternation in structure with the single zigzag of wave (ii) green.
Within the first zigzag of wave (iv) green, labeled wave w orange, wave C purple is 1.05 points short of equality with wave A purple. The small downwards wave labeled x orange subdivides clearly into a “three” on the 5 minute chart.
My only question today: is the second zigzag of wave y orange complete? On the 5 minute chart it does not look like the final C wave within it is over and I suspect we may see a little more upwards movement tomorrow.
Looking at the 5 minute chart it is possible that wave (iv) green could be over if it was a triple zigzag. However, triples are very rare indeed and I hesitate to label this as such. The possibility of a triple is valid, but the rarity of that structure makes the probability very low.
I have drawn a small orange channel about the upwards correction of wave (iv) green. We need to see this channel clearly breached to have confidence that wave (iv) green is over and wave (v) green is underway.
If price does move a little higher tomorrow then the green parallel channel drawn about wave v pink must be redrawn. Use Elliott’s second technique: draw the first trend line from the high labeled wave (ii) green to wherever wave (iv) green ends, then place a parallel copy upon the low labeled wave (iii) green. This channel may show us where wave (v) green ends, and it is most likely to end mid way within the channel at the point at which that intersects with the lower edge of the pink channel.
If wave (iv) green is over then at 1,252 wave (v) green would reach equality with wave (i) green. This gives us a relatively wide 7 point target zone and I favour the upper edge of that zone.
If wave (iv) green moves higher then the upper edge of the target zone will have to be recalculated. Wave (iv) green may not move into wave (i) green price territory. This wave count is invalidated with movement above 1,298.90.
Either way, whether wave (iv) green is over here or it moves a little higher, we still need to see one final wave downwards to complete the entire structure of wave 3 blue. When that is complete then we should expect a deeper and much longer lasting correction for wave 4 blue. That may begin at the end of this week, or if wave (v) green takes its time perhaps into next week.
Alternate Daily Wave Count.
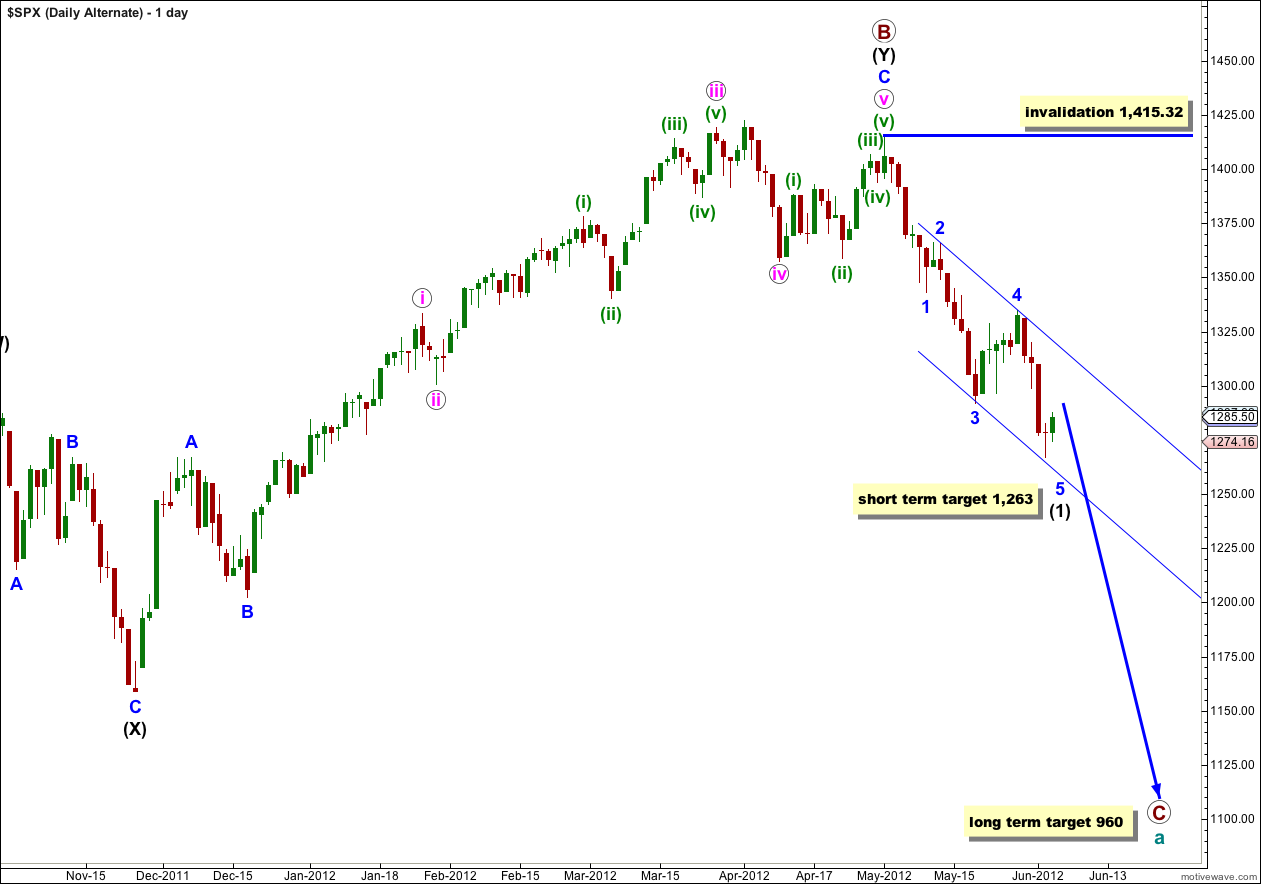
Primary wave B may have ended at 1,415.32 with a fifth wave truncation. The truncation reduces the probability of this alternate.
If primary wave C has more recently begun then it is probably within wave (1) black.
When wave (1) black is complete this alternate would expect a second wave correction for wave (2) black. Wave (2) black can move right up to, but not above, 1,415.32.
At that stage this wave count would diverge from our main wave count. The price point which differentiates the two is 1,357.38. The main wave count would not allow movement above that price point and this alternate would see it as reasonably likely. If price did move above 1,357.38 the main wave count would be invalidated and this alternate would be our sole wave count.
At this stage this alternate does not differ in its expectation of what should happen next. This alternate requires further downwards movement to complete the five wave impulsive structure of wave (1) black. I have recalculated the mid term target for this alternate wave count: at 1,263 wave 5 blue would reach equality with wave 1 blue. If price keeps falling through this first target, or if it gets there and the structure is incomplete, the next calculated target would be 1,218 where wave 5 blue would be extended and would be 1.618 the length of wave 1 blue.
is there any alternative count indicating V green and V pink completed, so we are on wave 4 Blue ?
that is the only wave count I can see which would explain this sharp rise.
I had the analysis of that last fifth wave wrong; it is over already and this is 4 blue which I expected to arrive next week, not this week.
Lara,
do you have an alternative count now that your hourly count is invalidated?
Thank you,
Rumors POPS the market up once again (Fed Considers More Action).
Looks like we could be looking at going over 1422 into Aug once again.
at this stage that makes no sense with this wave count which has an invalidation point at 1,357.38 (after next analysis that is). I’ll be looking for an alternate after today’s invalidation which allows for new highs, but if I cannot see one which looks right and possible I’ll not be publishing one.
yeah, I read something you linked me to about that yesterday. if this is a C wave down then the Fed will not be able to do anything about it. nothing they do will be able to stop the momentum, particularly when we get into the third wave for (3) black of primary C. If my wave count is correct that is!
One day at a time is best …
E-mini starting to look like the end of minor wave 1 1318.25 just under your upper channel line tonight.
50 – 62% retrace would be nice now.
Hi Lara,
With movement above 1298.90 our wave count was invalidated. Does (iii) green now become (i) orange, is this a bearish setup and is the new invalidation placed at iv pink circle? Thanks.
I’ll be covering all this in detail in today’s analysis.
This is wave 4 blue, arrived earlier than expected by a few days.
The invalidation point is now at 1,357.38
Thank you
Hi Lara,
Based on the current preferred count, since wave 2 is abc, after wave 3 blue is completed, we can expect a sharp rally for wave 4?
yes we can, and it is here already, a few days earlier than expected. I’ll go over this in detail in today’s analysis.
Thank you Lara.
Good afternoon Lara, I can’t watch your video in office, is there a way I can access your 5min chart?
Based on the 5min chart that you have described, am I correct to say that the upwards movements yesterday for S&P looks corrective ?
I don’t publish the 5 minute chart because it’s just not reliable enough.
It’s not on the video anyway.
Yes, upwards movement looks very clearly corrective compared to prior downwards movement.