
Last analysis had a short term target at 1,261. It looks like this wave has ended 6.74 points short of the target at Monday’s low of 1,266.74.
Today I have a short term target for tomorrow’s session. When a small correction is over I expect the long held mid term target to be met about the end of this week.
I still have only one hourly wave count which suffices for both daily wave counts as they do not diverge yet. This hourly wave count is nicely explaining recent movement and should continue to do so.
Click on the charts below to enlarge.
We have recently seen a very large trend change on the S&P 500 and a new downwards trend, to last months, has begun.
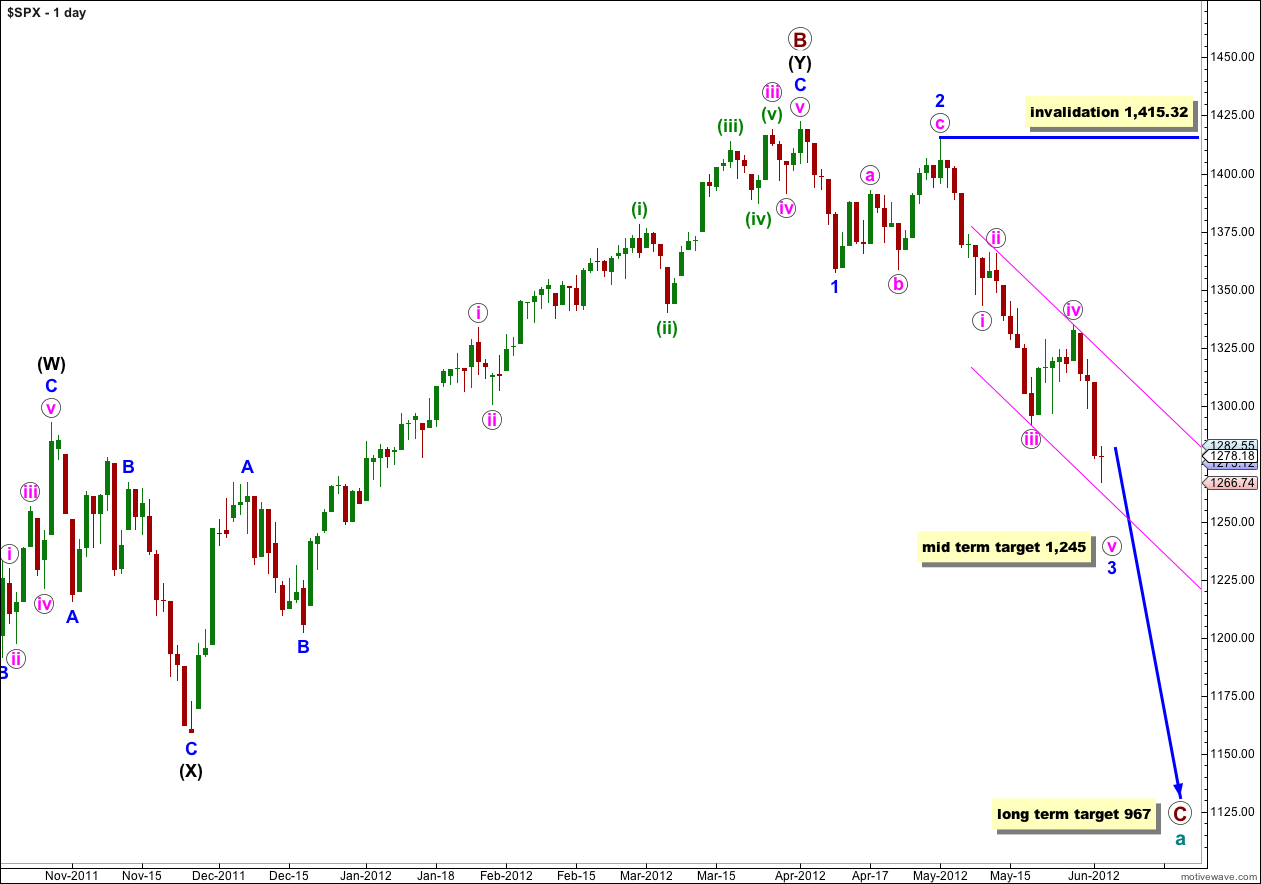
At cycle degree wave a (teal green) is an expanded flat correction. Primary wave A (maroon) within it subdivides into a three, and primary wave B is over 105% of primary wave A at 123%. The minimum requirements for an expanded flat are met. We should expect primary wave C to subdivide into a five and move price substantially below the end of primary wave A at 1,074.77.
At 967 primary wave C would reach 1.618 the length of primary wave A. If price continues through this first target, or it gets there and the structure is incomplete, then our second (less likely) target is at 685 where primary wave C would reach 2.618 the length of primary wave A.
Primary wave A lasted 4 months. Primary wave B lasted 6 months. We may expect primary wave C to last at least 4 months, if not longer.
Within wave 3 blue no second wave correction may move beyond the start of the first wave. This wave count is invalidated with movement above 1,415.32. When the structure of wave 3 blue is complete then the invalidation point can be moved to the low of wave 1 blue at 1,357.38.

For last analysis I suspected that we may see an increase in downwards momentum for Monday’s session, and that the target at 1,261 may have been too high. This was not the case, and the target was too low. On the 5 minute chart all subdivisions are now complete. Upwards movement to end the session looks like the beginning of wave (iv) green.
Wave (ii) green was a relatively deep zigzag at 58% of wave (i) green. We will most likely see alternation in depth of correction with wave (iv) green remaining under 50% of wave (iii) green, but it looks like we may not see alternation in structure. Wave (iv) green looks most like an unfolding zigzag.
When the first zigzag of wave (iv) green is complete then there is a reasonable probability that wave (iv) green could continue further as a double zigzag or double combination in order to achieve alternation in structure with wave (ii) green. This means there is a reasonable probability that wave (iv) green could last another two sessions.
When the first zigzag is complete then we shall have to look for a clear five down to follow it to be able to confirm that the correction for wave (iv) green is over.
Within this first zigzag wave c orange would reach equality with wave a orange at 1,286. This would see wave (iv) green end about the 0.382 Fibonacci ratio of wave (iii) green.
Wave (iv) green may not move into wave (i) green price territory. This wave count is invalidated with movement above 1,298.90.
For the next one or two sessions we should expect choppy, overlapping and slightly higher movement.
Alternate Daily Wave Count.
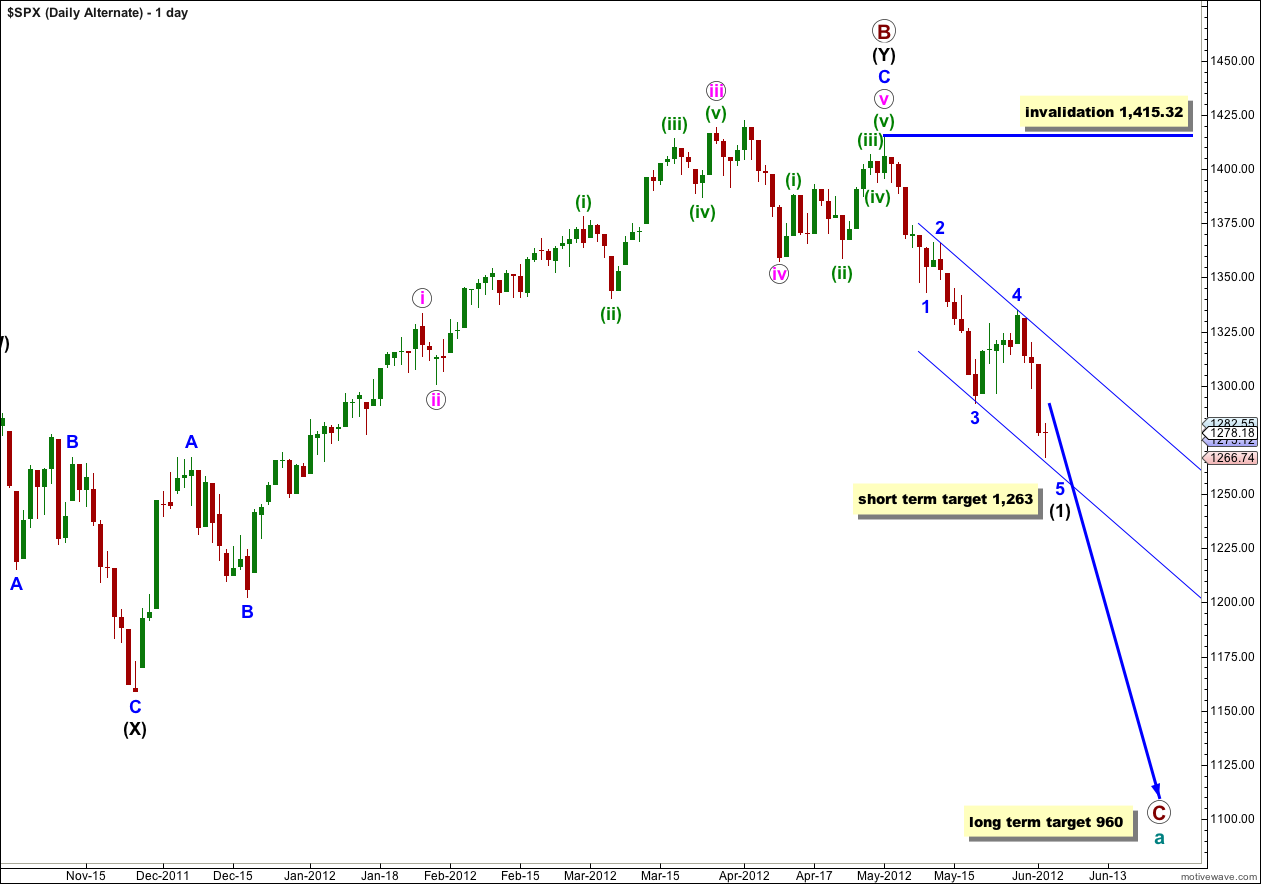
Primary wave B may have ended at 1,415.32 with a fifth wave truncation. The truncation reduces the probability of this alternate.
If primary wave C has more recently begun then it is probably within wave (1) black.
When wave (1) black is complete this alternate would expect a second wave correction for wave (2) black. Wave (2) black can move right up to, but not above, 1,415.32.
At that stage this wave count would diverge from our main wave count. The price point which differentiates the two is 1,357.38. The main wave count would not allow movement above that price point and this alternate would see it as reasonably likely. If price did move above 1,357.38 the main wave count would be invalidated and this alternate would be our sole wave count.
At this stage this alternate does not differ in its expectation of what should happen next. This alternate requires further downwards movement to complete the five wave impulsive structure of wave (1) black. I have recalculated the mid term target for this alternate wave count: at 1,263 wave 5 blue would reach equality with wave 1 blue. If price keeps falling through this first target, or if it gets there and the structure is incomplete, the next calculated target would be 1,218 where wave 5 blue would be extended and would be 1.618 the length of wave 1 blue.
Here Come The Hilsenrath Leak: “Fed Considers More Action” http://www.zerohedge.com/news/here-come-hilsenrath-leak-fed-considers-more-action (It did however halt the drop in stocks for a month or two the last time)
Thank you for your prompt reply and pardon my ignorance.
no worries.
your welcome email has links to the historic analysis and the file which illustrates labeling for each degree.
I highly recommend reviewing both. it just makes the whole understanding of the wave count easier for you
Hi Lara,
Francis here from Singapore, I am a new subscriber.
If we are confident that the target of Primary wave C is 967, don’t you think that wave 3 ending around 1245 is a bit too short? If that is the case, that means Wave 5 has to be extended?
Thank you for answering my question.
Nope. It fits nicely.
Because 1,245 is just wave 3 blue within (1) black.
Primary wave C will subdivide into five waves at black (intermediate) degree. The main wave count has us still only within black wave (1).
another (possibly clearer) way to answer your question would be to say the target for this third wave at 1,245 is two degrees lower than the long term target.
your question indicates you may be viewing the targets as only one degree of difference