
In yesterday’s analysis I expected a small upwards correction to be followed by downwards movement, and my wave count overall expected price to move lower. We have a new low today. The small correction I expected did not happen straight away, but looks like it happened at the end of Thursday’s session.
So far this wave count continues to be correct and is nicely explaining price action for us. I expect the trend to continue until the short and then mid term targets are reached.
Click on the charts below to enlarge.
We have recently seen a very large trend change on the S&P 500 and a new downwards trend, to last months, has begun.
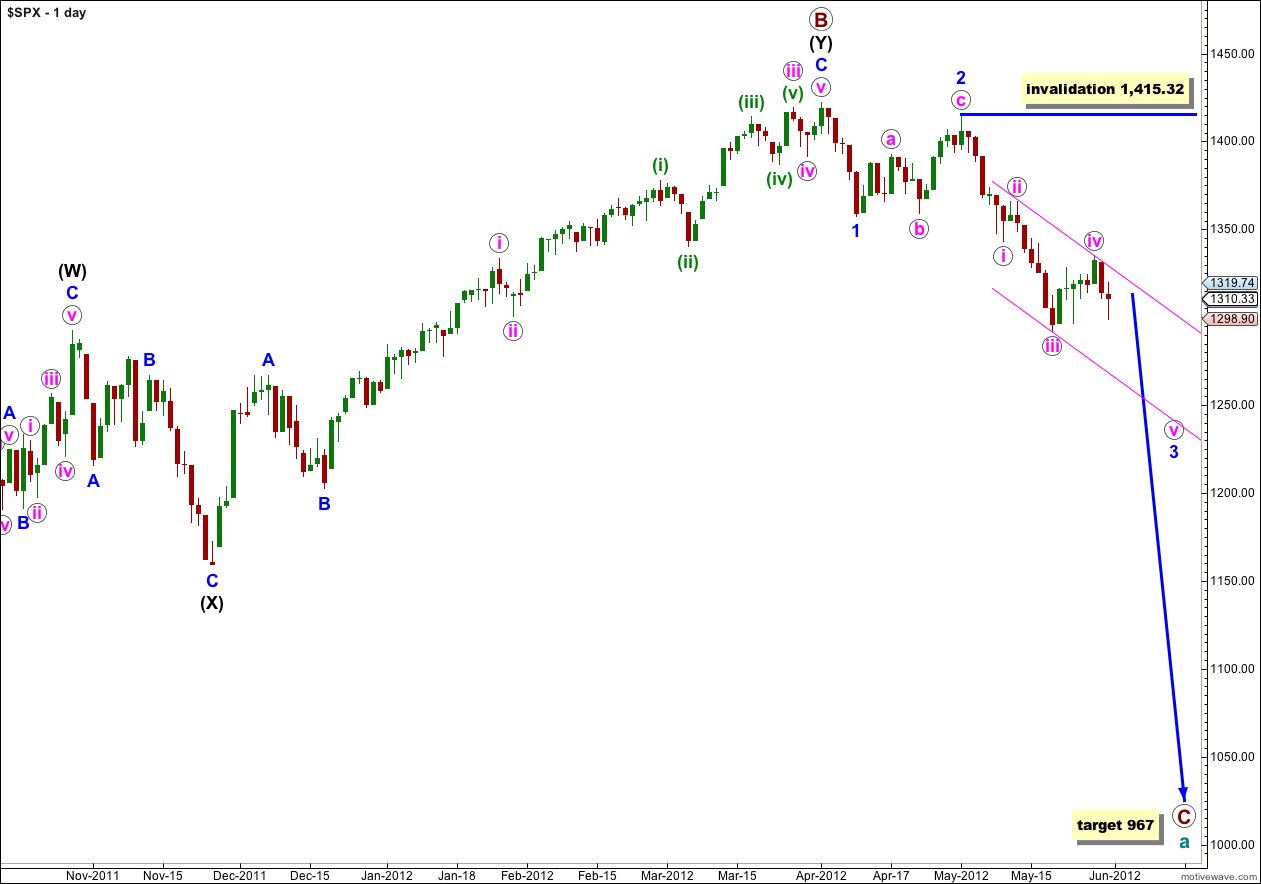
At cycle degree wave a (teal green) is an expanded flat correction. Primary wave A (maroon) within it subdivides into a three, and primary wave B is over 105% of primary wave A at 123%. The minimum requirements for an expanded flat are met. We should expect primary wave C to subdivide into a five and move price substantially below the end of primary wave A at 1,074.77.
At 967 primary wave C would reach 1.618 the length of primary wave A. If price continues through this first target, or it gets there and the structure is incomplete, then our second (less likely) target is at 685 where primary wave C would reach 2.618 the length of primary wave A.
Primary wave A lasted 4 months. Primary wave B lasted 6 months. We may expect primary wave C to last at least 4 months, if not longer.
Within wave 3 blue no second wave correction may move beyond the start of the first wave. This wave count is invalidated with movement above 1,415.32. When the structure of wave 3 blue is complete then the invalidation point can be moved to the low of wave 1 blue at 1,357.38.
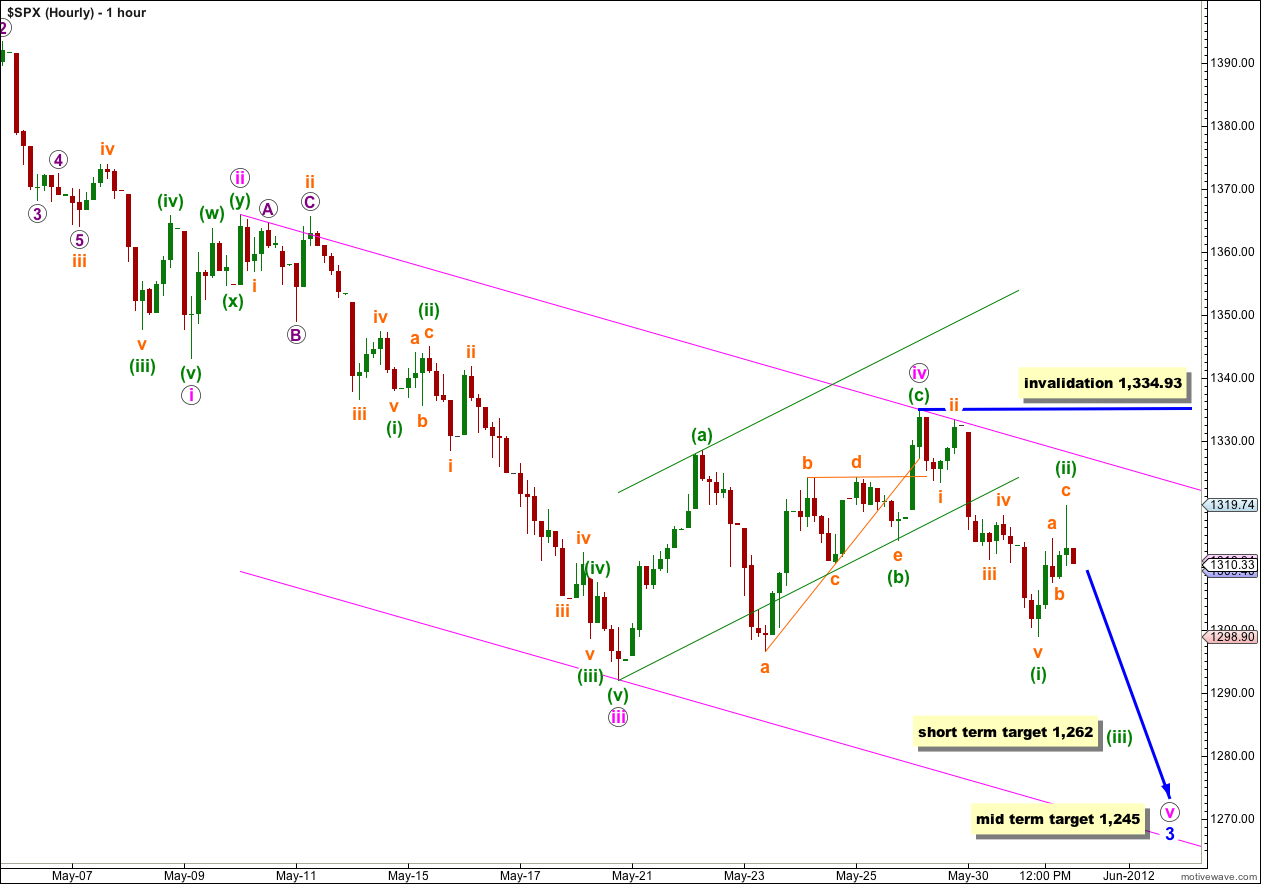
I had the end of wave (i) green labeled incorrectly and Thursday’s session began with further downwards movement. On the 5 minute chart what I thought was the end of wave v orange was only wave 1 of wave v orange. That is the problem of which degree to label a completed movement as I should have moved it down one degree.
Ratios within wave (i) green are: wave iii orange has no Fibonacci ratio to wave i orange, and wave v orange is just 0.62 points longer than 1.618 the length of wave i orange.
On the 5 minute chart wave (ii) green subdivides perfectly into a three wave zigzag. It is most likely that it is over here, and the end of Thursday’s session suggests with strong downwards movement that this is correct.
However, we must also accept there is a possibility that wave (ii) green is not complete. If we move the degree of labeling within it down one degree this may be only wave a orange within a second wave flat correction, or wave w orange as the first structure in a double for wave (ii) green. Only a clear five down to follow would eliminate this possibility and even on the 5 minute chart we don’t have that yet.
At this stage wave (ii) green looks to be nicely in proportion to wave (i) green and a very typical second wave structure. I think it is most likely that it is over.
Tomorrow we should see new lows with increasing momentum. At 1,262 wave (iii) green would reach 1.618 the length of wave (i) green. This short term target may be met in possibly one or more likely two sessions. It depends upon how time consuming the second and fourth wave corrections within the impulse for wave (iii) green turn out to be. What we should see is a clear five wave impulse and its subdivisions should be clearly seen on the hourly chart.
Any further upwards movement of wave (ii) green may not move beyond the start of wave (i) green. This wave count is invalidated with movement above 1,334.93. However, if wave (ii) green does continue further it may find resistance at the upper edge of the pink parallel channel drawn here.
Alternate Daily Wave Count.
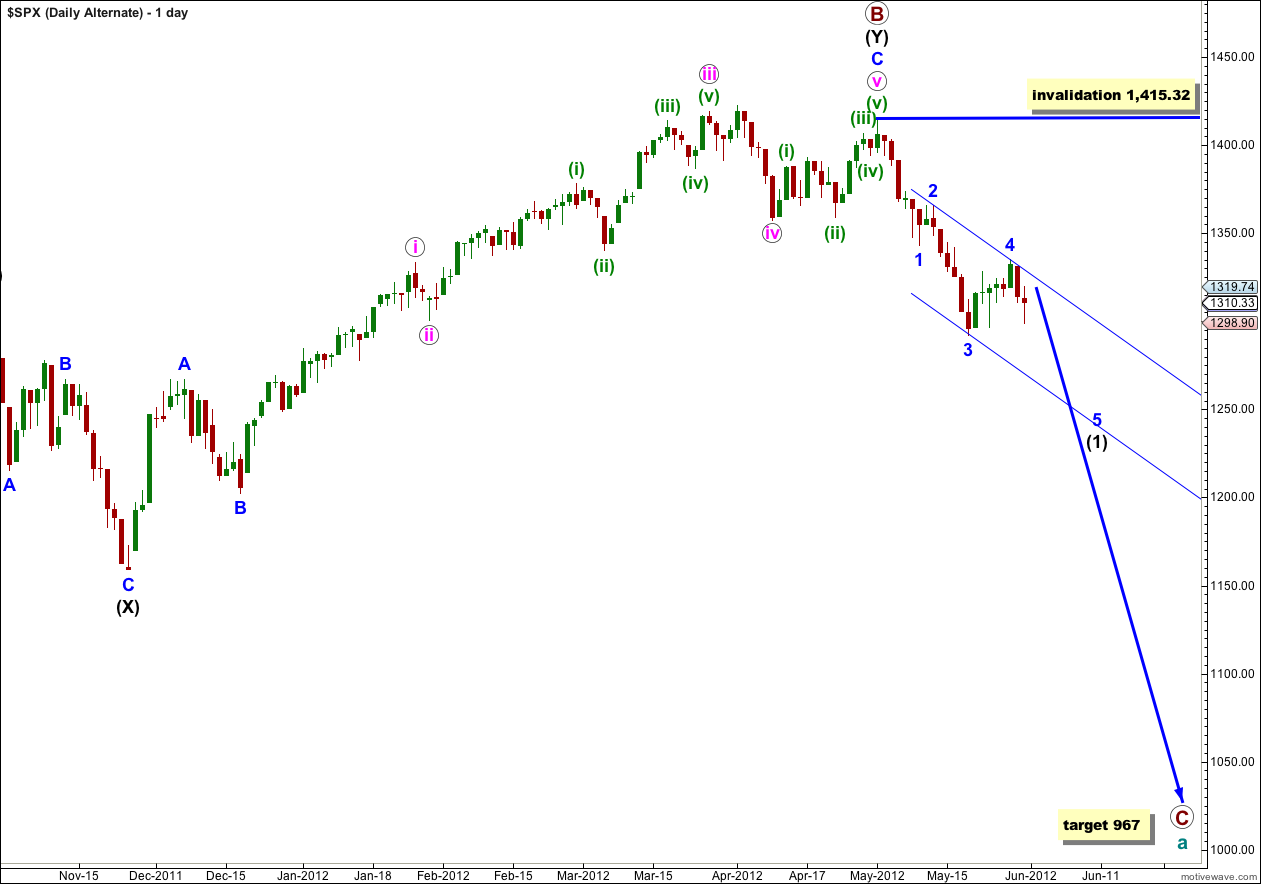
Primary wave B may have ended at 1,415.32 with a fifth wave truncation. The truncation reduces the probability of this alternate.
If primary wave C has more recently begun then it is probably within wave (1) black. A fourth wave correction for wave 4 blue would be either just complete or close to completion, and wave (1) black would be incomplete. On the hourly chart this alternate would be mostly the same as our main wave count.
When wave (1) black is complete this alternate would expect a second wave correction for wave (2) black. Wave (2) black can move right up to, but not above, 1,415.32.
At that stage this wave count would diverge from our main wave count. The price point which differentiates the two is 1,357.38. The main wave count would not allow movement above that price point and this alternate would see it as reasonably likely. If price did move above 1,357.38 the main wave count would be invalidated and this alternate would be our sole wave count.
At this stage this alternate does not differ in its expectation of what should happen next. This alternate requires further downwards movement to complete the five wave impulsive structure of wave (1) black.
Lara, excellent work…
I am trying to do the math on the 1245 target. I can get close, but I am missing something. Help.
That is probably because primary A began at 1,356.48 on 7th July, 2011 and not at the price high of 1,370.58 on 2nd May, 2011.
Primary A from 1,356.48 to 1,074.77 was 281.71 points in length.
Primary C begins at 1,422.38 for our main wave count. 1,422.38 – (281.71 X 1.618) = 966.57 which I round up to 967.
And the Mid Term Target = 281.71 * .618 = 1248.28 ??? Please elaborate/confirm.
Nope. The mid term target is at blue degree. Blue wave 1 from 1,422.38 to 1,357.38 was 65 points. Blue wave 3 began at 1,415.32.
1,415.32 – (65 X 2.618) = 1,245.15
I’m so sorry! I totally mis read your first question. I don’t know how that happened… temporary blonde moment?
Thanks