
Price has moved higher to complete a small correction. The triangle structure was invalidated, but price has remained below the invalidation point for the correction.
I still have two daily wave counts, but both expect exactly the same direction next and targets are the same.
I have only one hourly wave count today.
Click on the charts below to enlarge.
I have moved the degree of labeling for recent movement all up one degree because it has a better fit within the monthly chart. This labeling also fits better with expected duration for wave degrees; blue (minor degree) waves are not seen as lasting weeks not months, and pink (minute) degree is seen as lasting days not weeks.
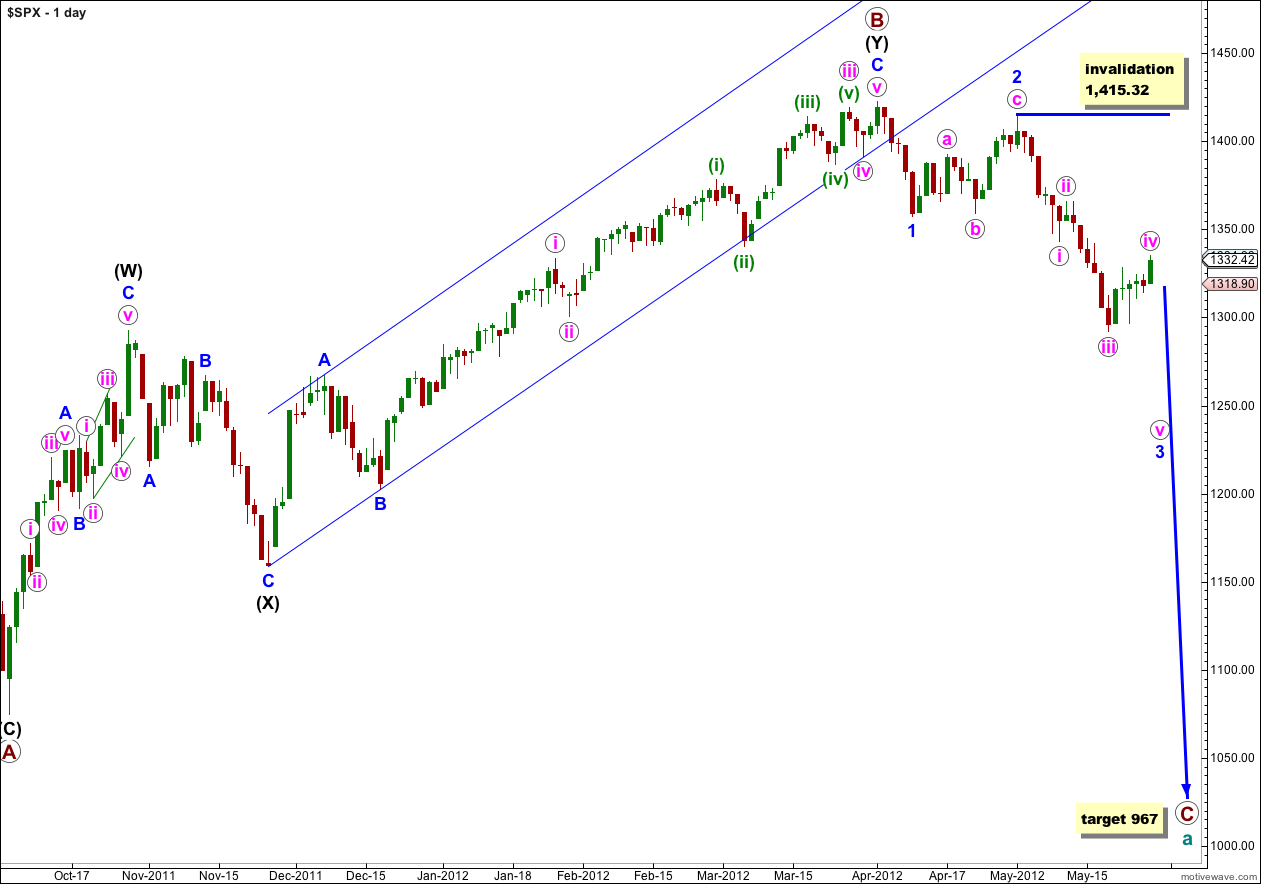
We have recently seen a very large trend change on the S&P 500 and a new downwards trend, to last months, has begun.
At cycle degree wave a (teal green) is an expanded flat correction. Primary wave A (maroon) within it subdivides into a three, and primary wave B is over 105% of primary wave A at 123%. The minimum requirements for an expanded flat are met. We should expect primary wave C to subdivide into a five and move price substantially below the end of primary wave A at 1,074.77.
At 967 primary wave C would reach 1.618 the length of primary wave A. If price continues through this first target, or it gets there and the structure is incomplete, then our second (less likely) target is at 685 where primary wave C would reach 2.618 the length of primary wave A.
Primary wave A lasted 4 months. Primary wave B lasted 6 months. We may expect primary wave C to last at least 4 months, if not longer.
Within wave 3 blue no second wave correction may move beyond the start of the first wave. This wave count is invalidated with movement above 1,415.32. When the structure of wave 3 blue is complete then the invalidation point can be moved to the low of wave 1 blue at 1,357.38.
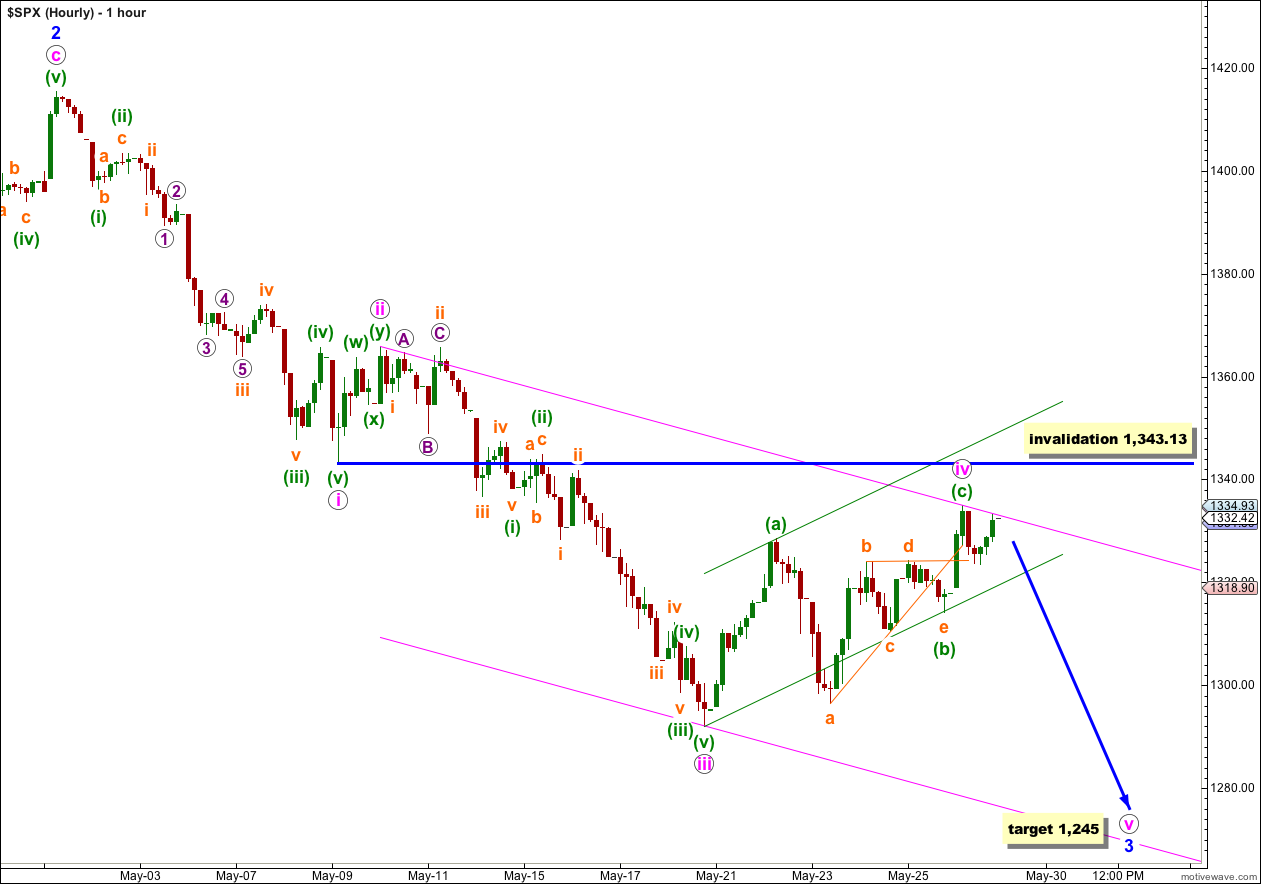
Further upwards movement above 1,324.20 invalidated the triangle for wave iv pink. Wave iv pink looks like a simple zigzag structure, with a barrier triangle in its wave (b) green position.
At this stage wave iv pink may be over. Wave (c) green is just 1.86 points short of 0.618 the length of wave (a) green.
We may draw a parallel channel about wave 3 blue using Elliott’s second technique now: draw the first trend line from the highs of waves ii to iv pink, then place a parallel copy upon the low of wave iii pink. Wave v pink may end either mid way within this channel (more likely) or about the lower edge of the channel (less likely).
Because there is a very nice relationship of equality between waves i and iii pink it is less likely that we shall see a Fibonacci ratio between wave v pink and either of i or iii pink.
At 1,245 wave 3 blue would reach 2.618 the length of wave 1 blue. This remains our target for this next downwards wave to end.
Wave iv pink could extend a very little higher, although it has little room now to move in. Wave iv pink may touch the end of wave i pink at 1,343.13 but any movement at all, even a fraction of a point, above that price would invalidate this wave count.
If this wave count is invalidated tomorrow with upwards movement then I would consider that my analysis of all downwards movement since the start of wave 3 blue is incorrect and the third wave would already be over. I think that is unlikely and I have confidence in this analysis.
Alternate Daily Wave Count.
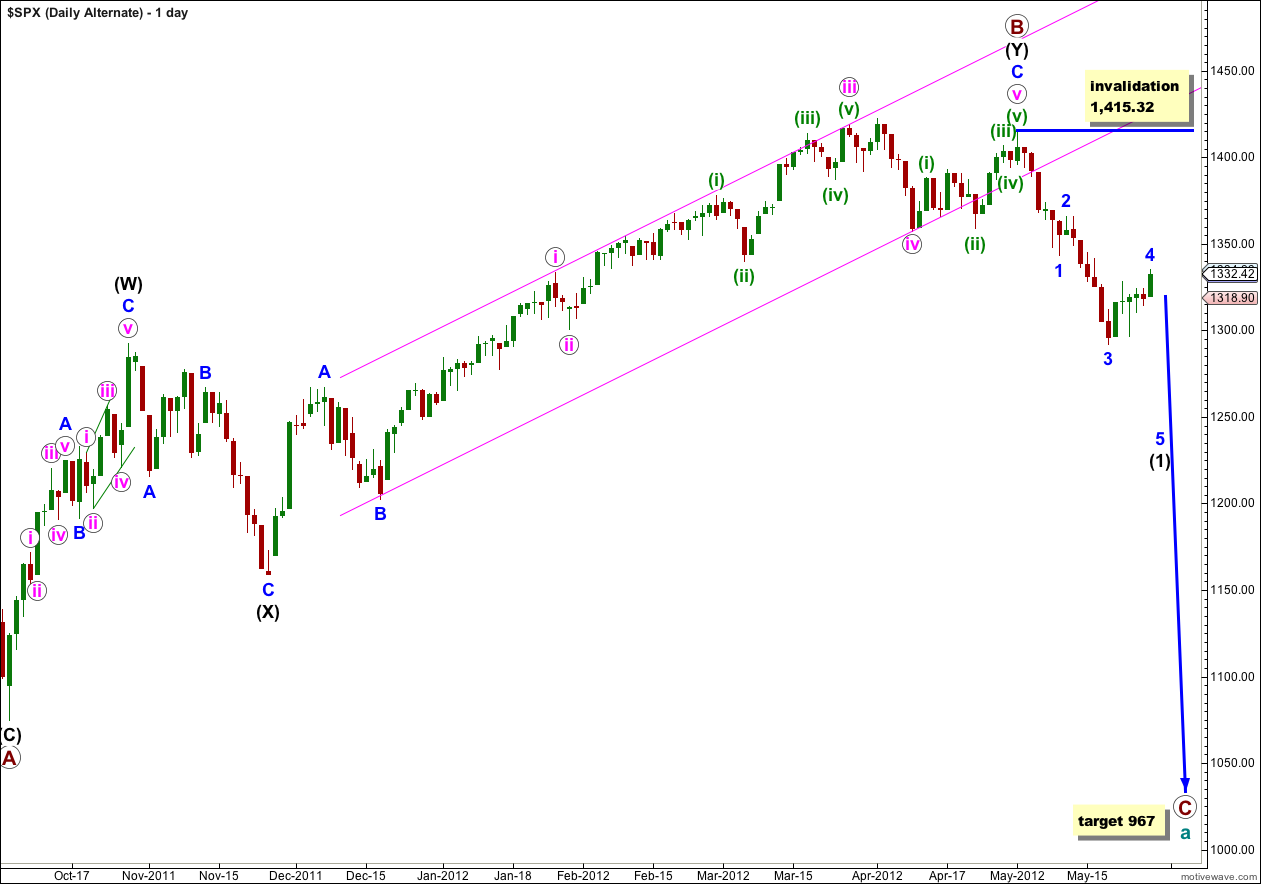
I have been aware now for a couple of weeks that my DJIA and S&P 500 wave counts do not match. This alternate is an attempt to bring them back together.
Primary wave B may have ended at 1,415.32 with a fifth wave truncation. The truncation reduces the probability of this alternate.
If primary wave C has more recently begun then it is probably within wave (1) black. A fourth wave correction for wave 4 blue would be either just complete or close to completion, and wave (1) black would be incomplete. On the hourly chart this alternate would be mostly the same as our main wave count.
When wave (1) black is complete this alternate would expect a second wave correction for wave (2) black. Wave (2) black can move right up to, but not above, 1,415.32.
At that stage this wave count would diverge from our main wave count. The price point which differentiates the two is 1,357.38. The main wave count would not allow movement above that price point and this alternate would see it as reasonably likely. If price did move above 1,357.38 the main wave count would be invalidated and this alternate would be our sole wave count.
At this stage this alternate does not differ in its expectation of what should happen next. This alternate requires further downwards movement to complete the five wave impulsive structure of wave (1) black.
that’s great, thank you so much for posting the link to your chart
it is SOOOO much easier for me to see what you mean with a chart, and yes, that’s pretty interesting. I would expect the left hand side would be pretty unlikely, it would require a sheer drop, and this fifth wave would not have that much momentum. if the right hand side is correct we’re in for a protracted downwards step. that one looks entirely possible to me
Hi Lara,
As a comment, in your hourly analysis, you say wave V pink is more likely to be completed mid way between the channel (downtrend pink), of that is true, it will take probably all June to get there. Really good analysis, and hopefully we go down tomorrow so your count is not invalidated. 🙂
Thanks,
Yeah, that is true. And it could be a long drawn out process. Or the target is wrong. When the fifth wave has 1 and 3 within it complete I’ll use a degree lower to calculate any other possible targets.
If you start a pitchfork midline on the top of wave ii pink and draw this midline to connect bottom of wave iii pink to top of wave iv pink you can create a pitchfork channel. Using this pitchfork channel the following potential times can be calculated to reach 1,245:-
1) The lower channel line of this pitchfork will reach 1,245 in approx. 2.5 trading sessions from wednesday close.
2) The midline of this pitchfork channel will reach 1,245 in approx, 7.5 trading sessions from wednesday close.
3) The top channel line of this pitchfork will reach 1,245 in approx. 12 trading sessions from wednesday close. Top channel line of pitchform also intersets the line connecting wave 1 blue and wave iii pink at 1,245.
Being a wave v of a wave 3 the line connecting wave 1 blue and wave iii pink has reasonable chance to be overshot. Given that assumption and using the pitchfork analysis, 1,245 could be reached sometime between 2.5 and 7.5 tradings sessions from wednesday close. Obviously these projected times are totally dependent on an accurate wave count.
A chart would describe this much better but haven’t figured out how to attach charts to the comments. Is this possible?
thanks for that, and you’re right a chart would be the thing!
you can’t attach a chart directly here but you can upload it to another place and put a link in comments
twitpic, stocktwits etc would work
I ‘see’ your idea and thanks for the ideas on duration.
Posted a chart on twitpics. Try this link and see if it works.
http://twitpic.com/9r85eg/full