
Price has again moved sideways within a very small range and this has prompted me to switch my main and alternate hourly charts around today. What was the alternate wave count now has the right look, with one subwave having moved slightly higher by 0.06 points.
The main and alternate daily wave counts have the same target and same invalidation point. They differ only in their expectation of how the structure downwards will unfold.
The main and alternate hourly charts also have the same target but slightly different invalidation points.
I have moved everything up one degree after taking another look at the historic wave counts on the monthly charts. This makes more sense now and wave degrees fit better with expected durations.
Click on the charts below to enlarge.

We have recently seen a very large trend change on the S&P 500 and a new downwards trend, to last months, has begun.
At cycle degree wave a (teal green) is an expanded flat correction. Primary wave A (maroon) within it subdivides into a three, and primary wave B is over 105% of primary wave A at 123%. The minimum requirements for an expanded flat are met. We should expect primary wave C to subdivide into a five and move price substantially below the end of primary wave A at 1,074.77.
At 967 primary wave C would reach 1.618 the length of primary wave A. If price continues through this first target, or it gets there and the structure is incomplete, then our second (less likely) target is at 685 where primary wave C would reach 2.618 the length of primary wave A.
Primary wave A lasted 4 months. Primary wave B lasted 6 months. We may expect primary wave C to last at least 4 months, if not longer.
Within wave 3 blue no second wave correction may move beyond the start of the first wave. This wave count is invalidated with movement above 1,415.32. When the structure of wave 3 blue is complete then the invalidation point can be moved to the low of wave 1 blue at 1,357.38.
Main Hourly Wave Count.
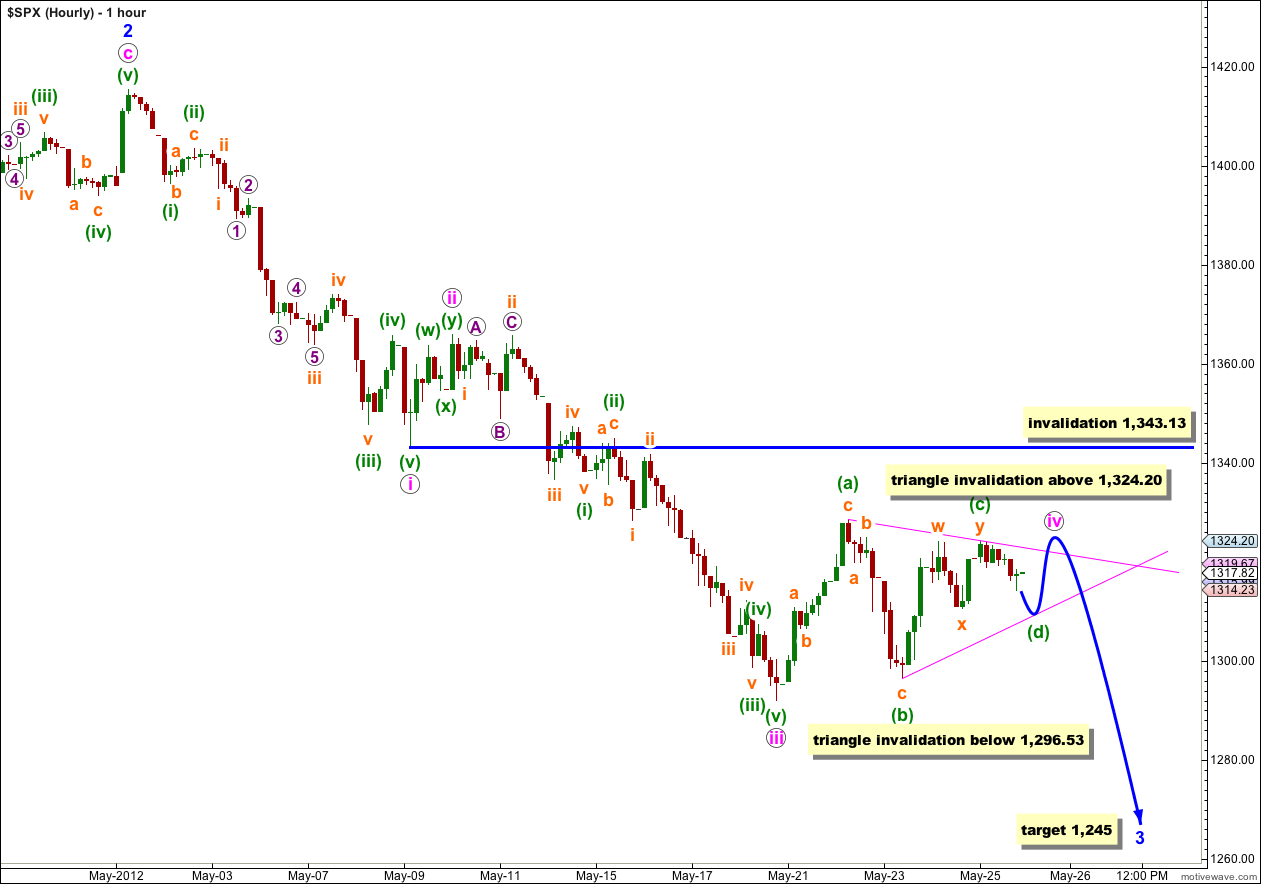
Although price moved 0.06 points above my triangle invalidation point, which was at 1,324.14, this triangle looks very typical. The upper triangle invalidation point was too close and should have been at 1,328.49, the high of wave a green.
Wave (c) green looks like it has unfolded as a double zigzag and moved very slightly higher. One of the five subwaves of a triangle should be longer lasting and more complicated than the others, and it is most likely to be the c wave, and this looks extremely typical.
Only one of the triangle subwaves can be a double, and we should expect wave (d) green downwards to be a single zigzag. Thereafter, wave (e) green upwards also should be a zigzag.
Wave (d) green may not move below the end of wave (b) green. The triangle is invalidated with movement below 1,296.53.
Thereafter, wave (e) green may end with either an overshoot or undershoot of the upper a-c trend line, but may not move beyond the end of wave (c) green at 1,324.20.
I will be expecting more sideways movement in a decreasing range for probably another two sessions before the triangle is complete. When it is complete wave v pink downwards may end at 1,245 where wave 3 blue would reach 2.618 the length of wave 1 blue
It is still possible, but now fairly unlikely, that wave iv pink is not unfolding as a triangle but is a flat or double flat correction. If the triangle is invalidated I shall again look at this possibility. Wave iv pink may not move into wave i pink price territory. This wave count is firmly invalidated with movement above 1,343.13.
Alternate Hourly Wave Count.
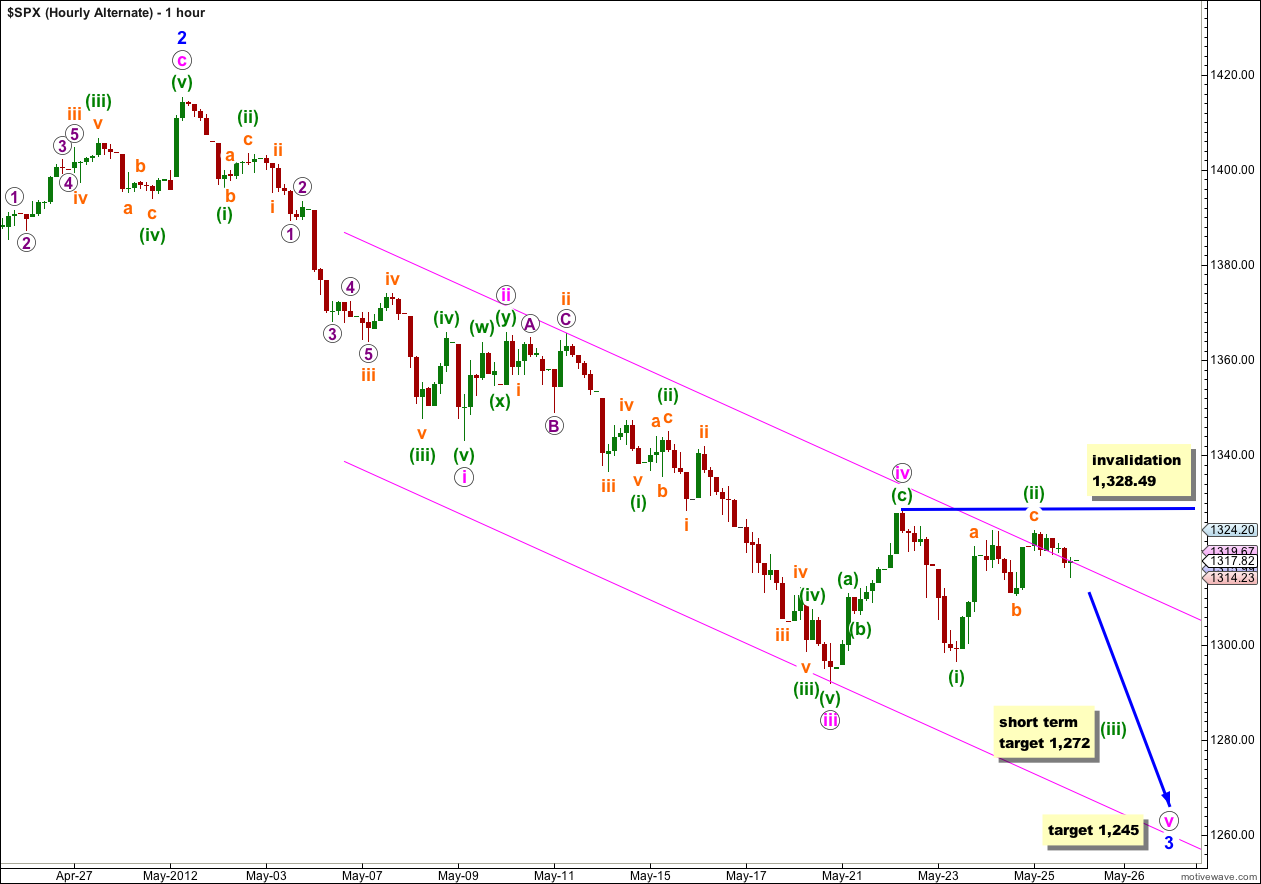
With price remaining below 1,328.49 this alternate remains valid. However, it just does not have the right look anymore and the probability that it is correct reduces. If wave ii orange has ended and wave iii orange has begun I would expect much stronger and clearer downwards movement, and that is not what we have seen.
At 1,272 wave (iii) green would reach 1.618 the length of wave (i) green. This short term target should be met within a day. If it is not then I will consider discarding this alternate wave count, even though it may remain technically valid.
The mid term target for wave 3 blue is exactly the same as for the main hourly wave count at 1,245.
If wave (ii) green moves higher it may not move beyond the start of wave (i) green. This wave count is invalidated with movement above 1,328.49.
Alternate Daily Wave Count.
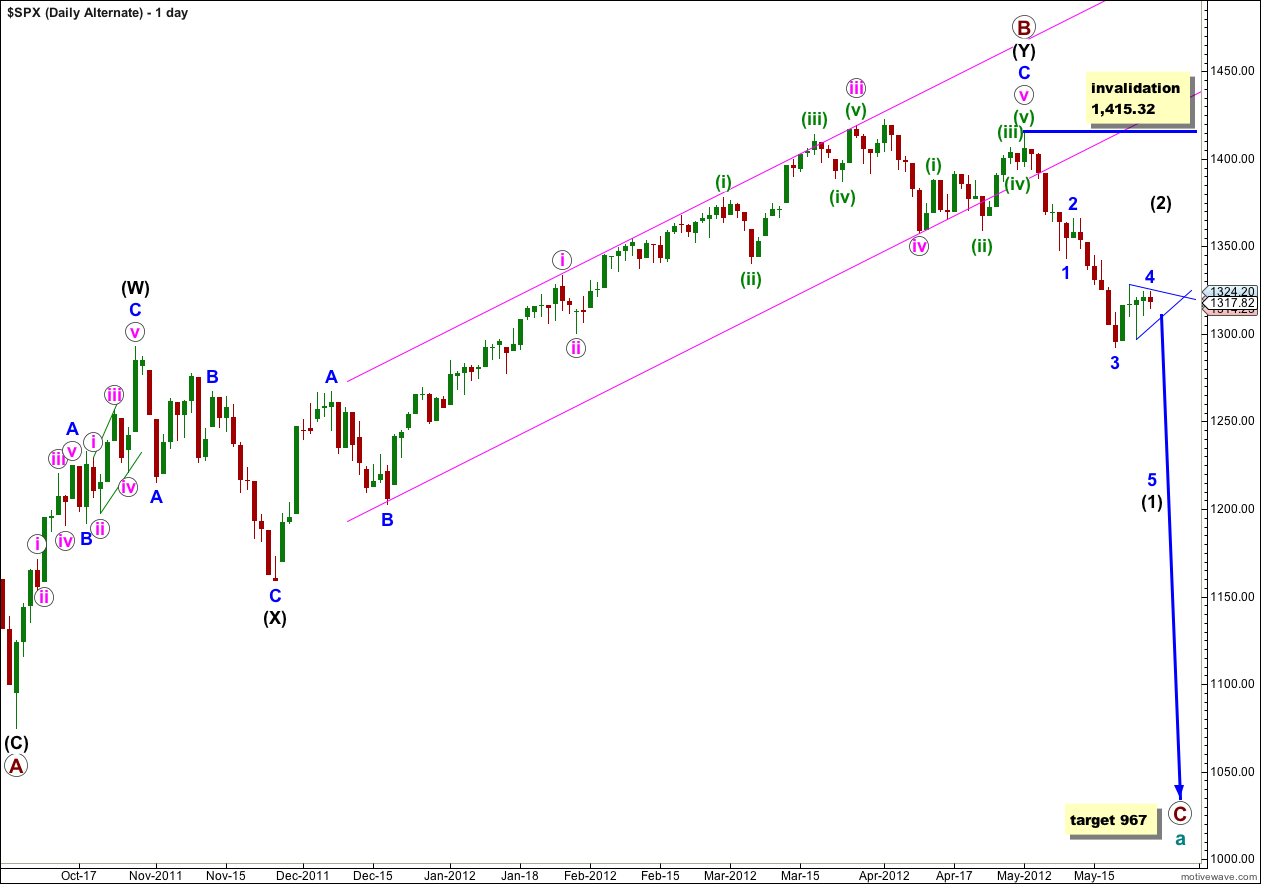
I have been aware now for a couple of weeks that my DJIA and S&P 500 wave counts do not match. This alternate is an attempt to bring them back together.
Primary wave B may have ended at 1,415.32 with a fifth wave truncation. The truncation reduces the probability of this alternate.
If primary wave C has more recently begun then it is probably within wave (1) black. A fourth wave correction for wave 4 blue would be either just complete or close to completion, and wave (1) black would be incomplete. On the hourly chart this alternate would be mostly the same as our main wave count.
When wave (1) black is complete this alternate would expect a second wave correction for wave (2) black. Wave (2) black can move right up to, but not above, 1,415.32.
At that stage this wave count would diverge from our main wave count. The price point which differentiates the two is 1,357.38. The main wave count would not allow movement above that price point and this alternate would see it as reasonably likely. If price did move above 1,357.38 the main wave count would be invalidated and this alternate would be our sole wave count.
At this stage this alternate does not differ in its expectation of what should happen next. This alternate requires further downwards movement to complete the five wave impulsive structure of wave (1) black.
With the NYMO now over 20 … I would think it will be very hard to hold this under 1343.13. I see the key area at 1357.38 over this and we started our 5th Wave up at 1291.98
Not sure why you moved everything up one degree on the daily. You didn’t explain why you did this. I’m confused. Would you provide an explanation?
I am sorry, you are right, my explanation was absent. It is because I took another look at the monthly chart and moving everything up one degree had a much better fit. It also makes the labeling fit better with expected time durations. I’ll briefly go over the monthly chart in todays video to show you what I mean.
Triangle don’t work for ES_F cuz of the 13 point push into 1329.75 early on 5/25/12. So, should we eliminate that particular wave count from SPX as well (green (c) going over green (a))?
No.
EW analysis takes each market as separate.
EW_F, being futures, has more leverage and thus more price extremes than the cash index would. Their wave counts will be a little different.