
Yesterday’s analysis of the S&P 500 expected downwards movement with increasing momentum, which is exactly what happened as price fell over 20 points. MACD indicated stronger downwards momentum and the short term target at 1,300 was almost reached.
I still have only one daily and one hourly wave count. So far the structure is unfolding exactly as this wave count expects.
Click on the charts below to enlarge.
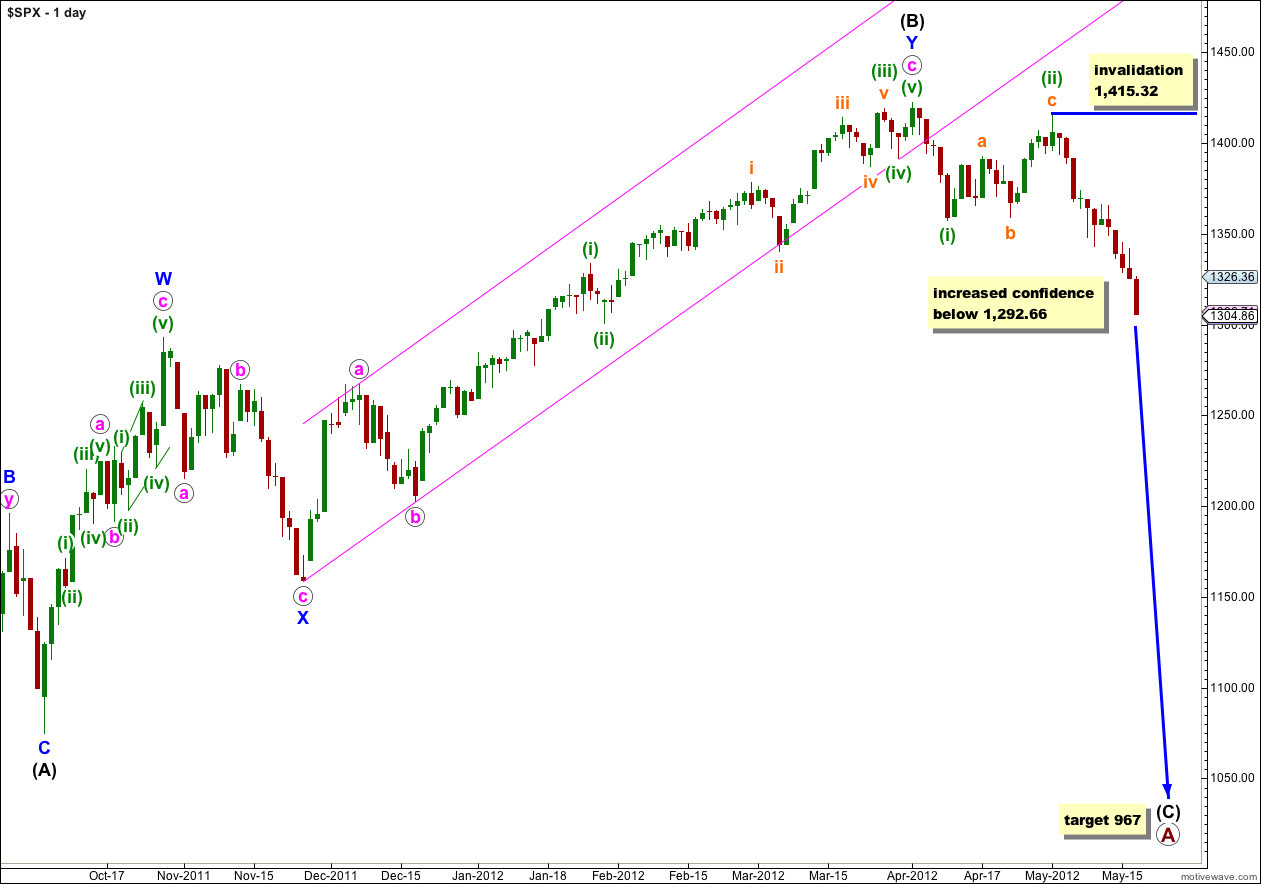
We have recently seen a very large trend change on the S&P 500 and a new downwards trend, to last months, has begun.
At primary degree wave A is an expanded flat correction. Wave (A) black within it subdivides into a three, and wave (B) black is over 105% of wave (A) black at 123%. The minimum requirements for an expanded flat are met. We should expect wave (C) black to subdivide into a five and move price substantially beyond the end of wave (A) black at 1,074.77.
At 967 wave (C) black would reach 1.618 the length of wave (A) black. If price continues through this first target, or it gets there and the structure is incomplete, then our second (less likely) target is at 685 where wave (C) black would reach 2.618 the length of wave (A) black.
Wave (A) black lasted 4 months. Wave (B) black lasted 6 months. We may expect wave (C) black to last at least 4 months, if not longer.
Within wave (iii) green no second wave correction may move beyond the start of the first wave. This wave count is invalidated with movement above 1,415.32. When the structure of wave (iii) green is complete then the invalidation point can be moved to the low of wave (i) green at 1,357.38.
When price falls below 1,292.66 then the upwards movement labeled (B) black cannot be a developing five up and it would be confirmed as a completed three. This would add further confidence to the trend change and expectation for wave (C) black to reach targets.
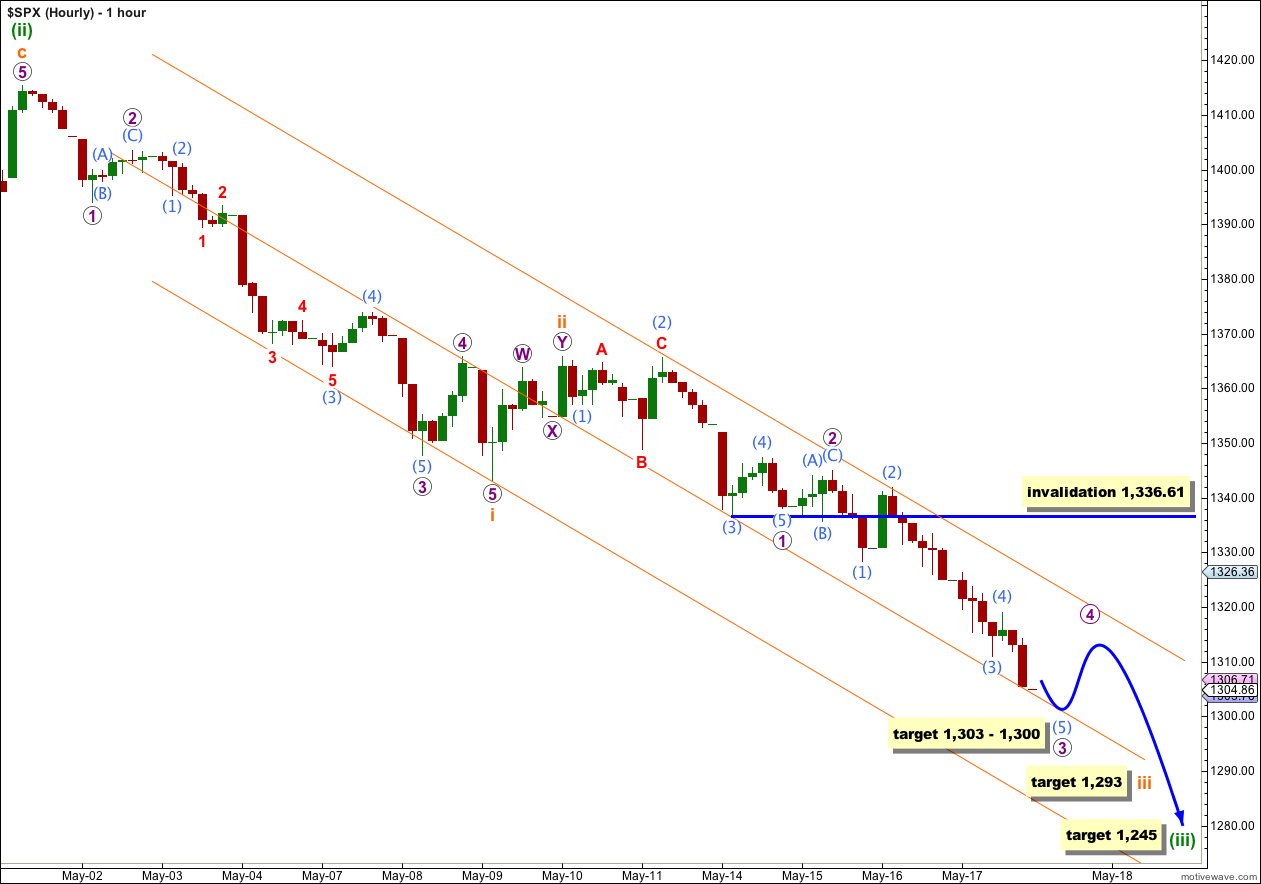
The middle of the third wave has unfolded as expected. It may be over here or it may move slightly lower tomorrow.
At 1,300 wave 3 purple would reach 1.618 the length of wave 1 purple. Within wave 3 purple there is no Fibonacci ratio between waves (3) and (1) aqua, and it is more likely that wave (5) aqua will exhibit a Fibonacci ratio to either of (1) or (3). At 1,303 wave (5) aqua would reach equality with wave (1) aqua. This gives us a 3 point target zone for a very little more downwards movement when markets open tomorrow.
Wave (5) aqua on the 5 minute chart may be seen as complete, or the final fifth wave within it may extend a little further.
Tomorrow’s session should see a little slow moving, choppy and overlapping upwards movement for wave 4 purple. Wave 4 purple may not move into wave 1 purple price territory. This wave count is invalidated with movement above 1,336.61.
Wave 2 purple was a very shallow expanded flat correction. Wave 4 purple may be a relatively deeper correction, although this is still within a third wave and alternation may be seen in structure but not necessarily depth of correction. Wave 4 purple is most likely to unfold as a zigzag, double, flat or triangle (in order of probability).
When the correction for wave 4 purple is complete (and it should not last an entire session) then further downwards movement for wave 5 purple towards the short / mid term target for wave iii orange should unfold. At 1,293 wave iii orange would reach equality with wave i orange.
The mid term target for wave (iii) green remains the same. At 1,245 wave (iii) green would reach 2.618 the length of wave (i) green. This target is still days away.
Downwards movement for Thursday’s session shows an increase in momentum on MACD. This wave count agrees so far with MACD giving me more confidence that it is correct.
The structure for this third wave is incomplete. It may take a few more days to a week or two to unfold. It will depend on how time consuming the two fourth wave corrections of 4 purple and iv orange will be.
wave C so far is not severe as wave A, is that normal? I remember you said wave C should be crash mode.
Yes, it’s only wave 1 within wave C so far. This is entirely normal.